Alex Cooke
Research
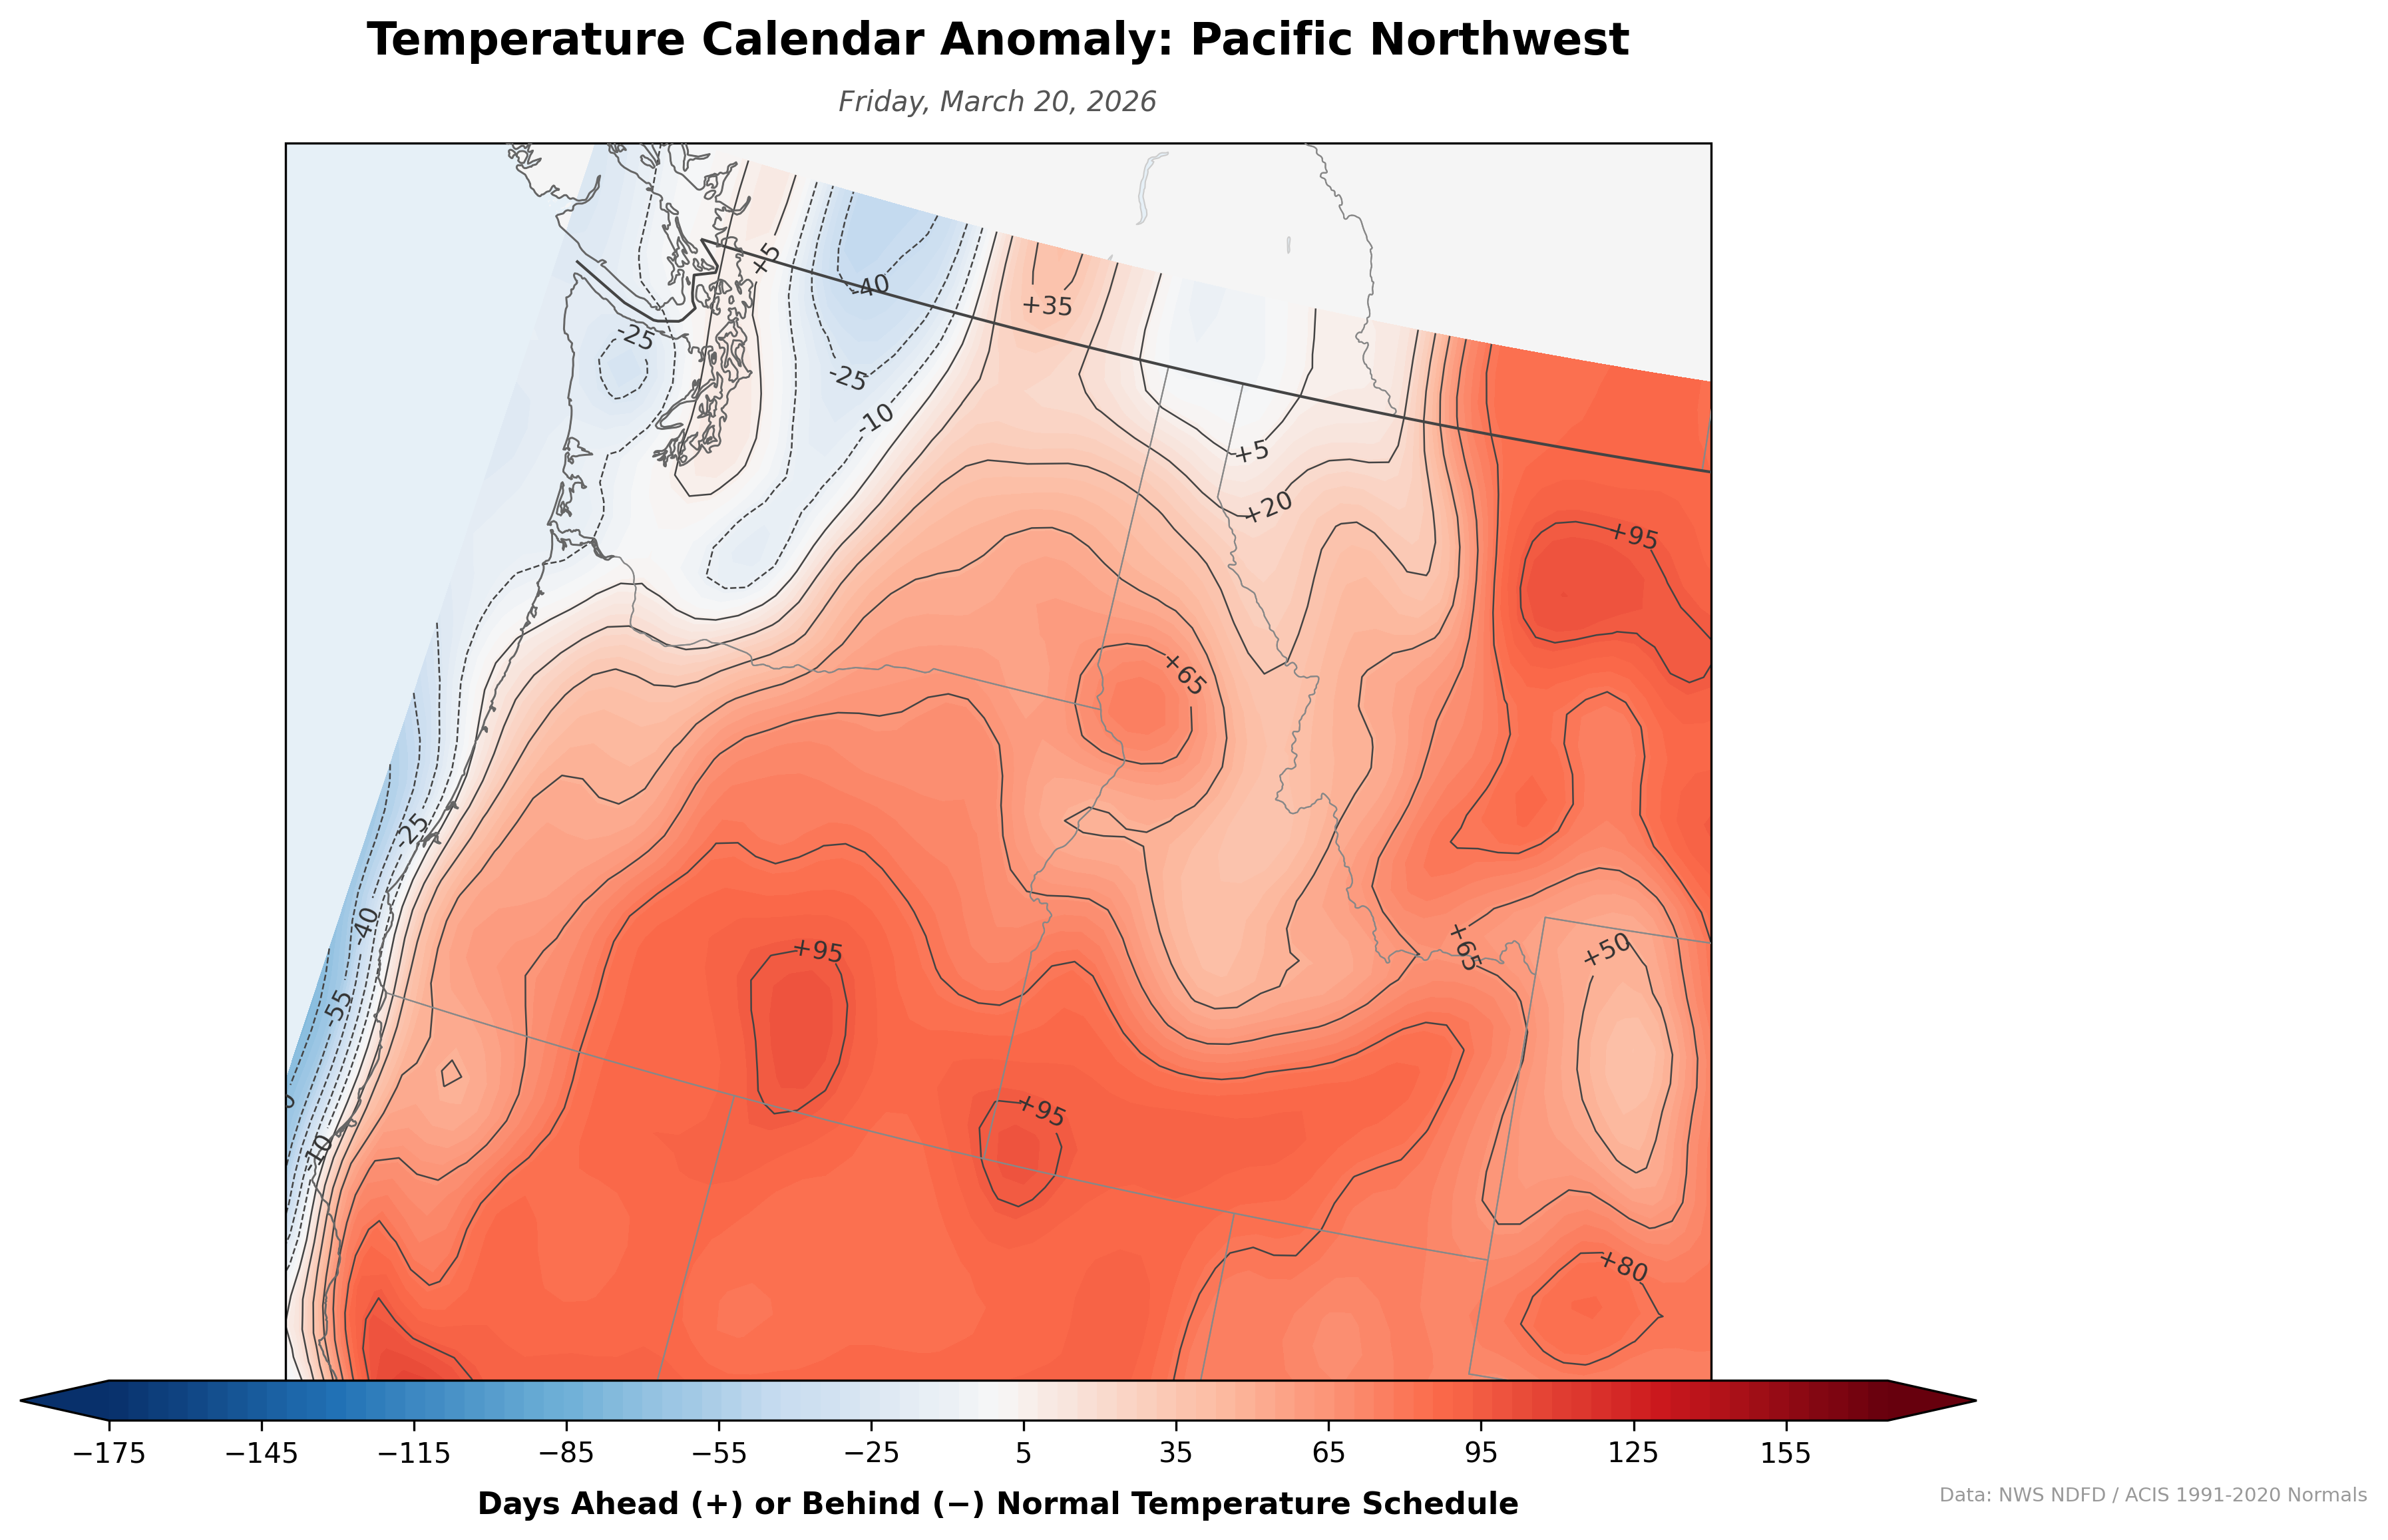
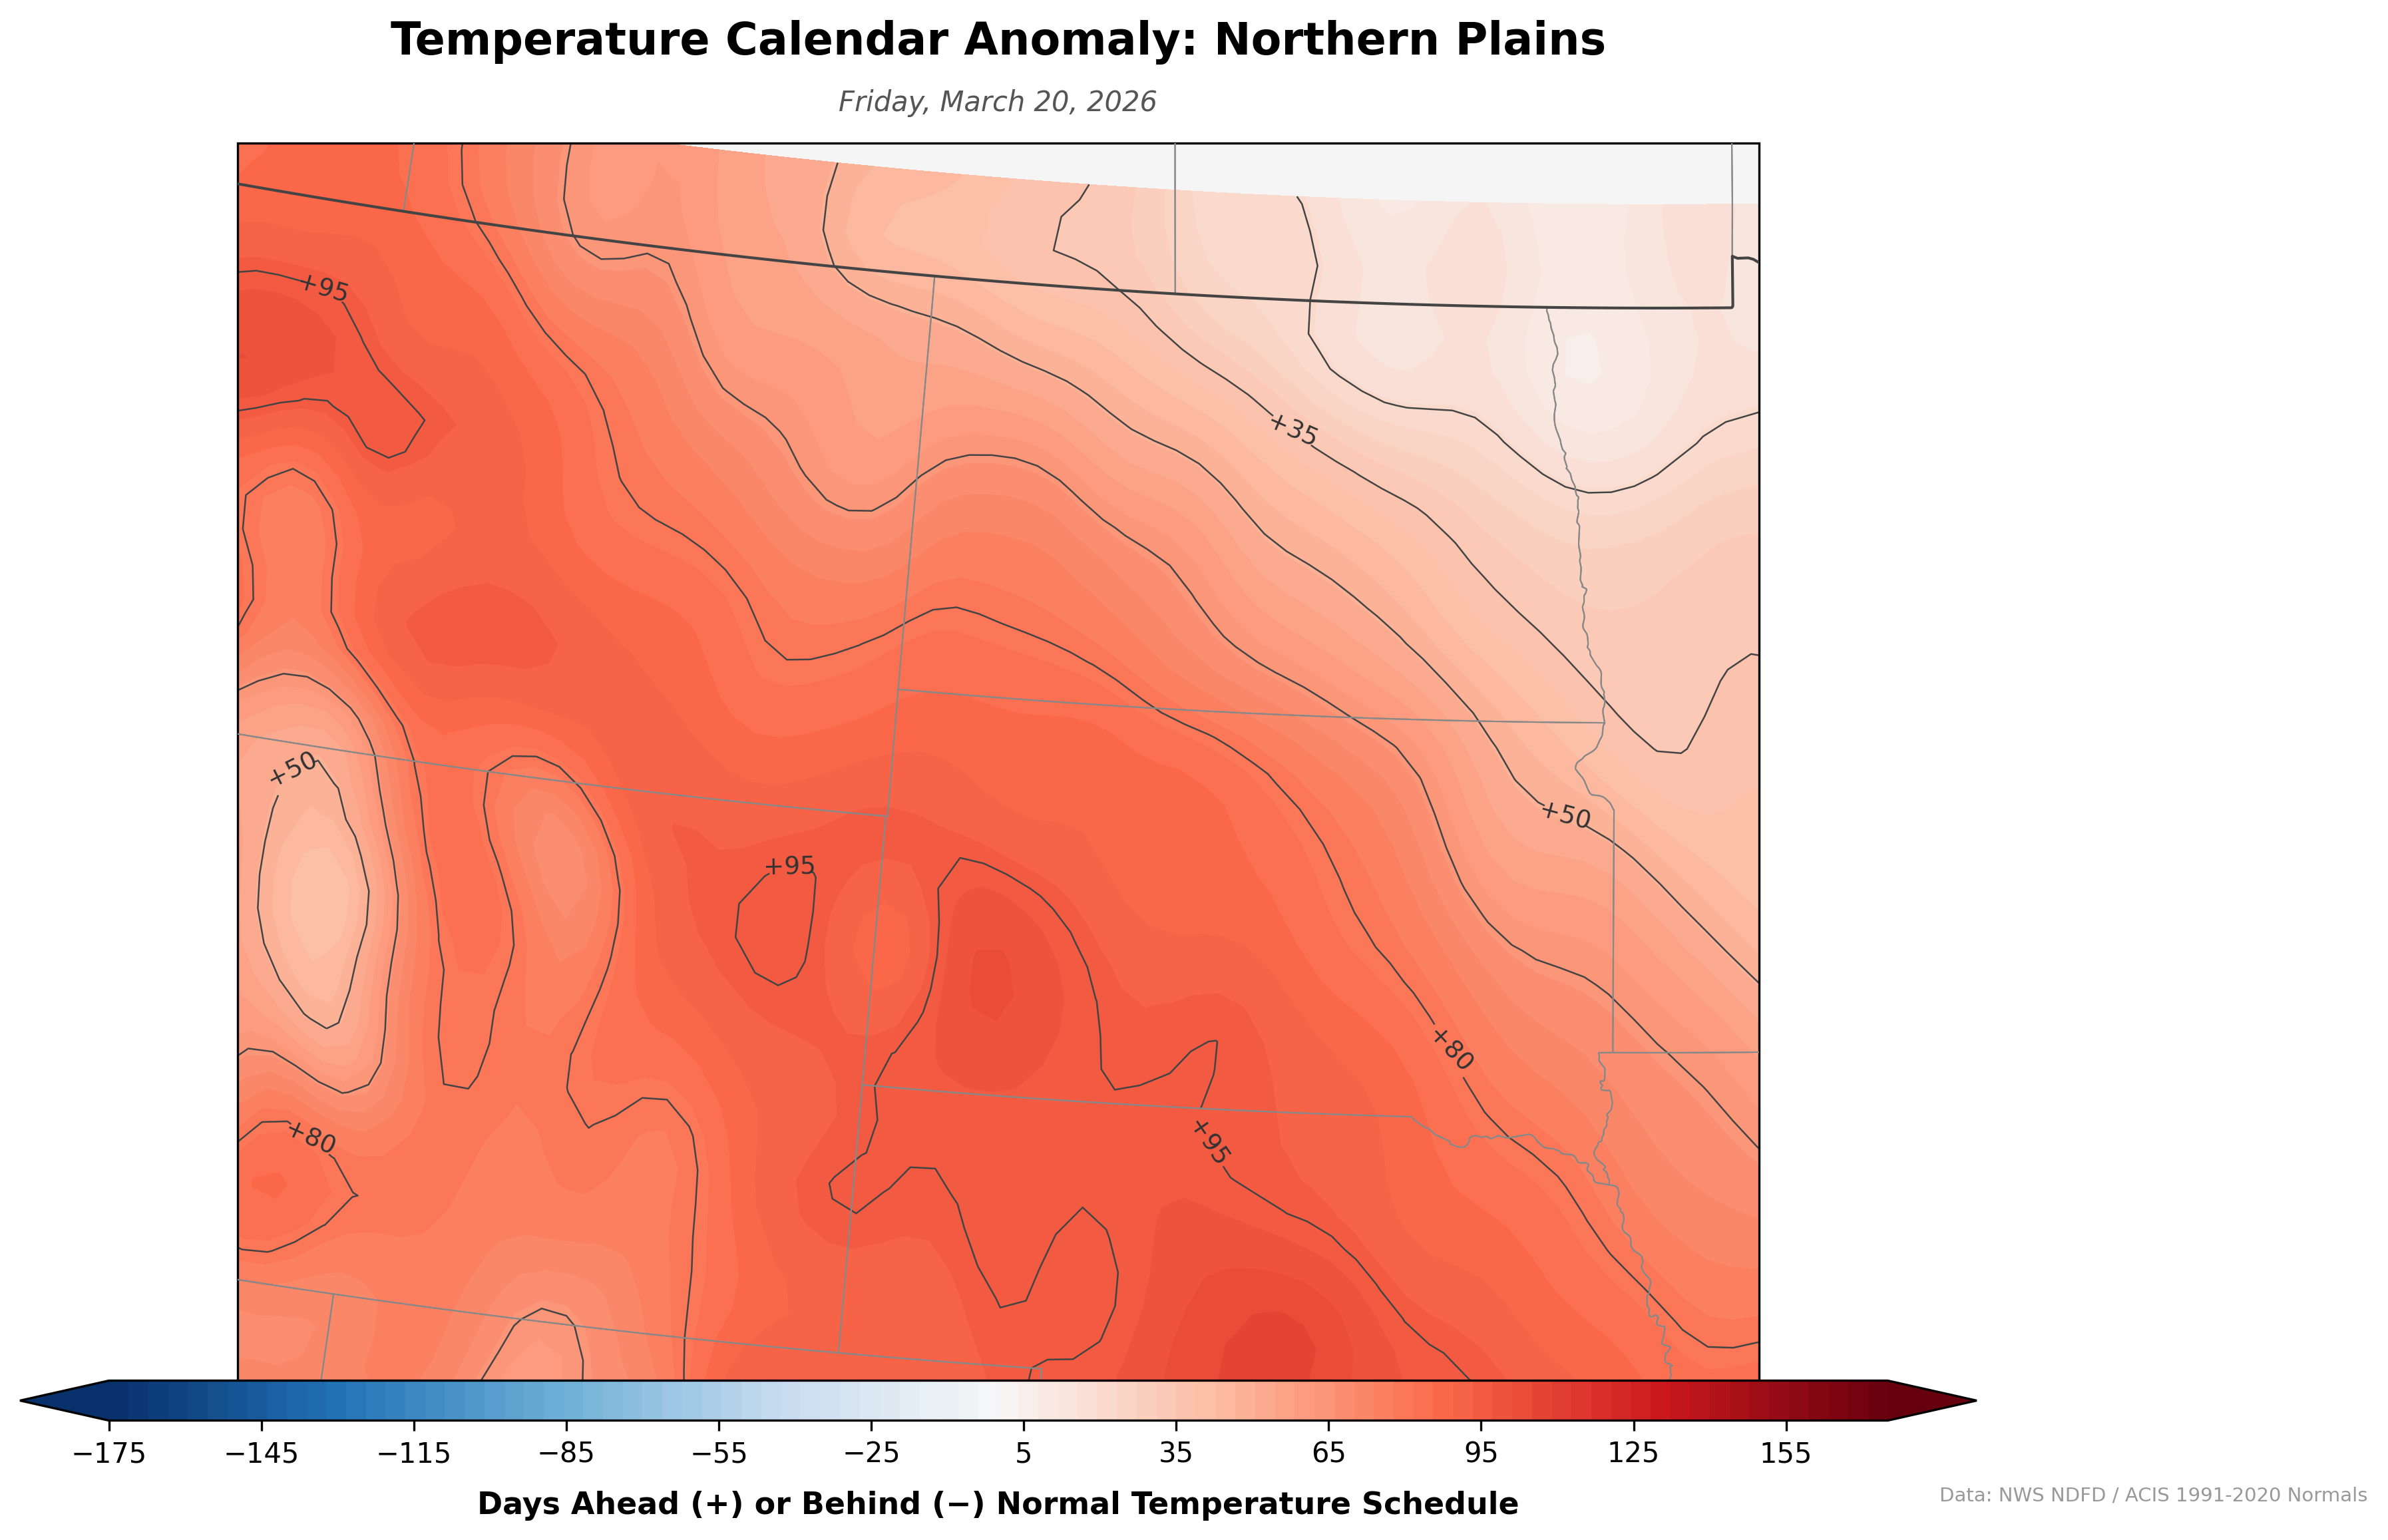
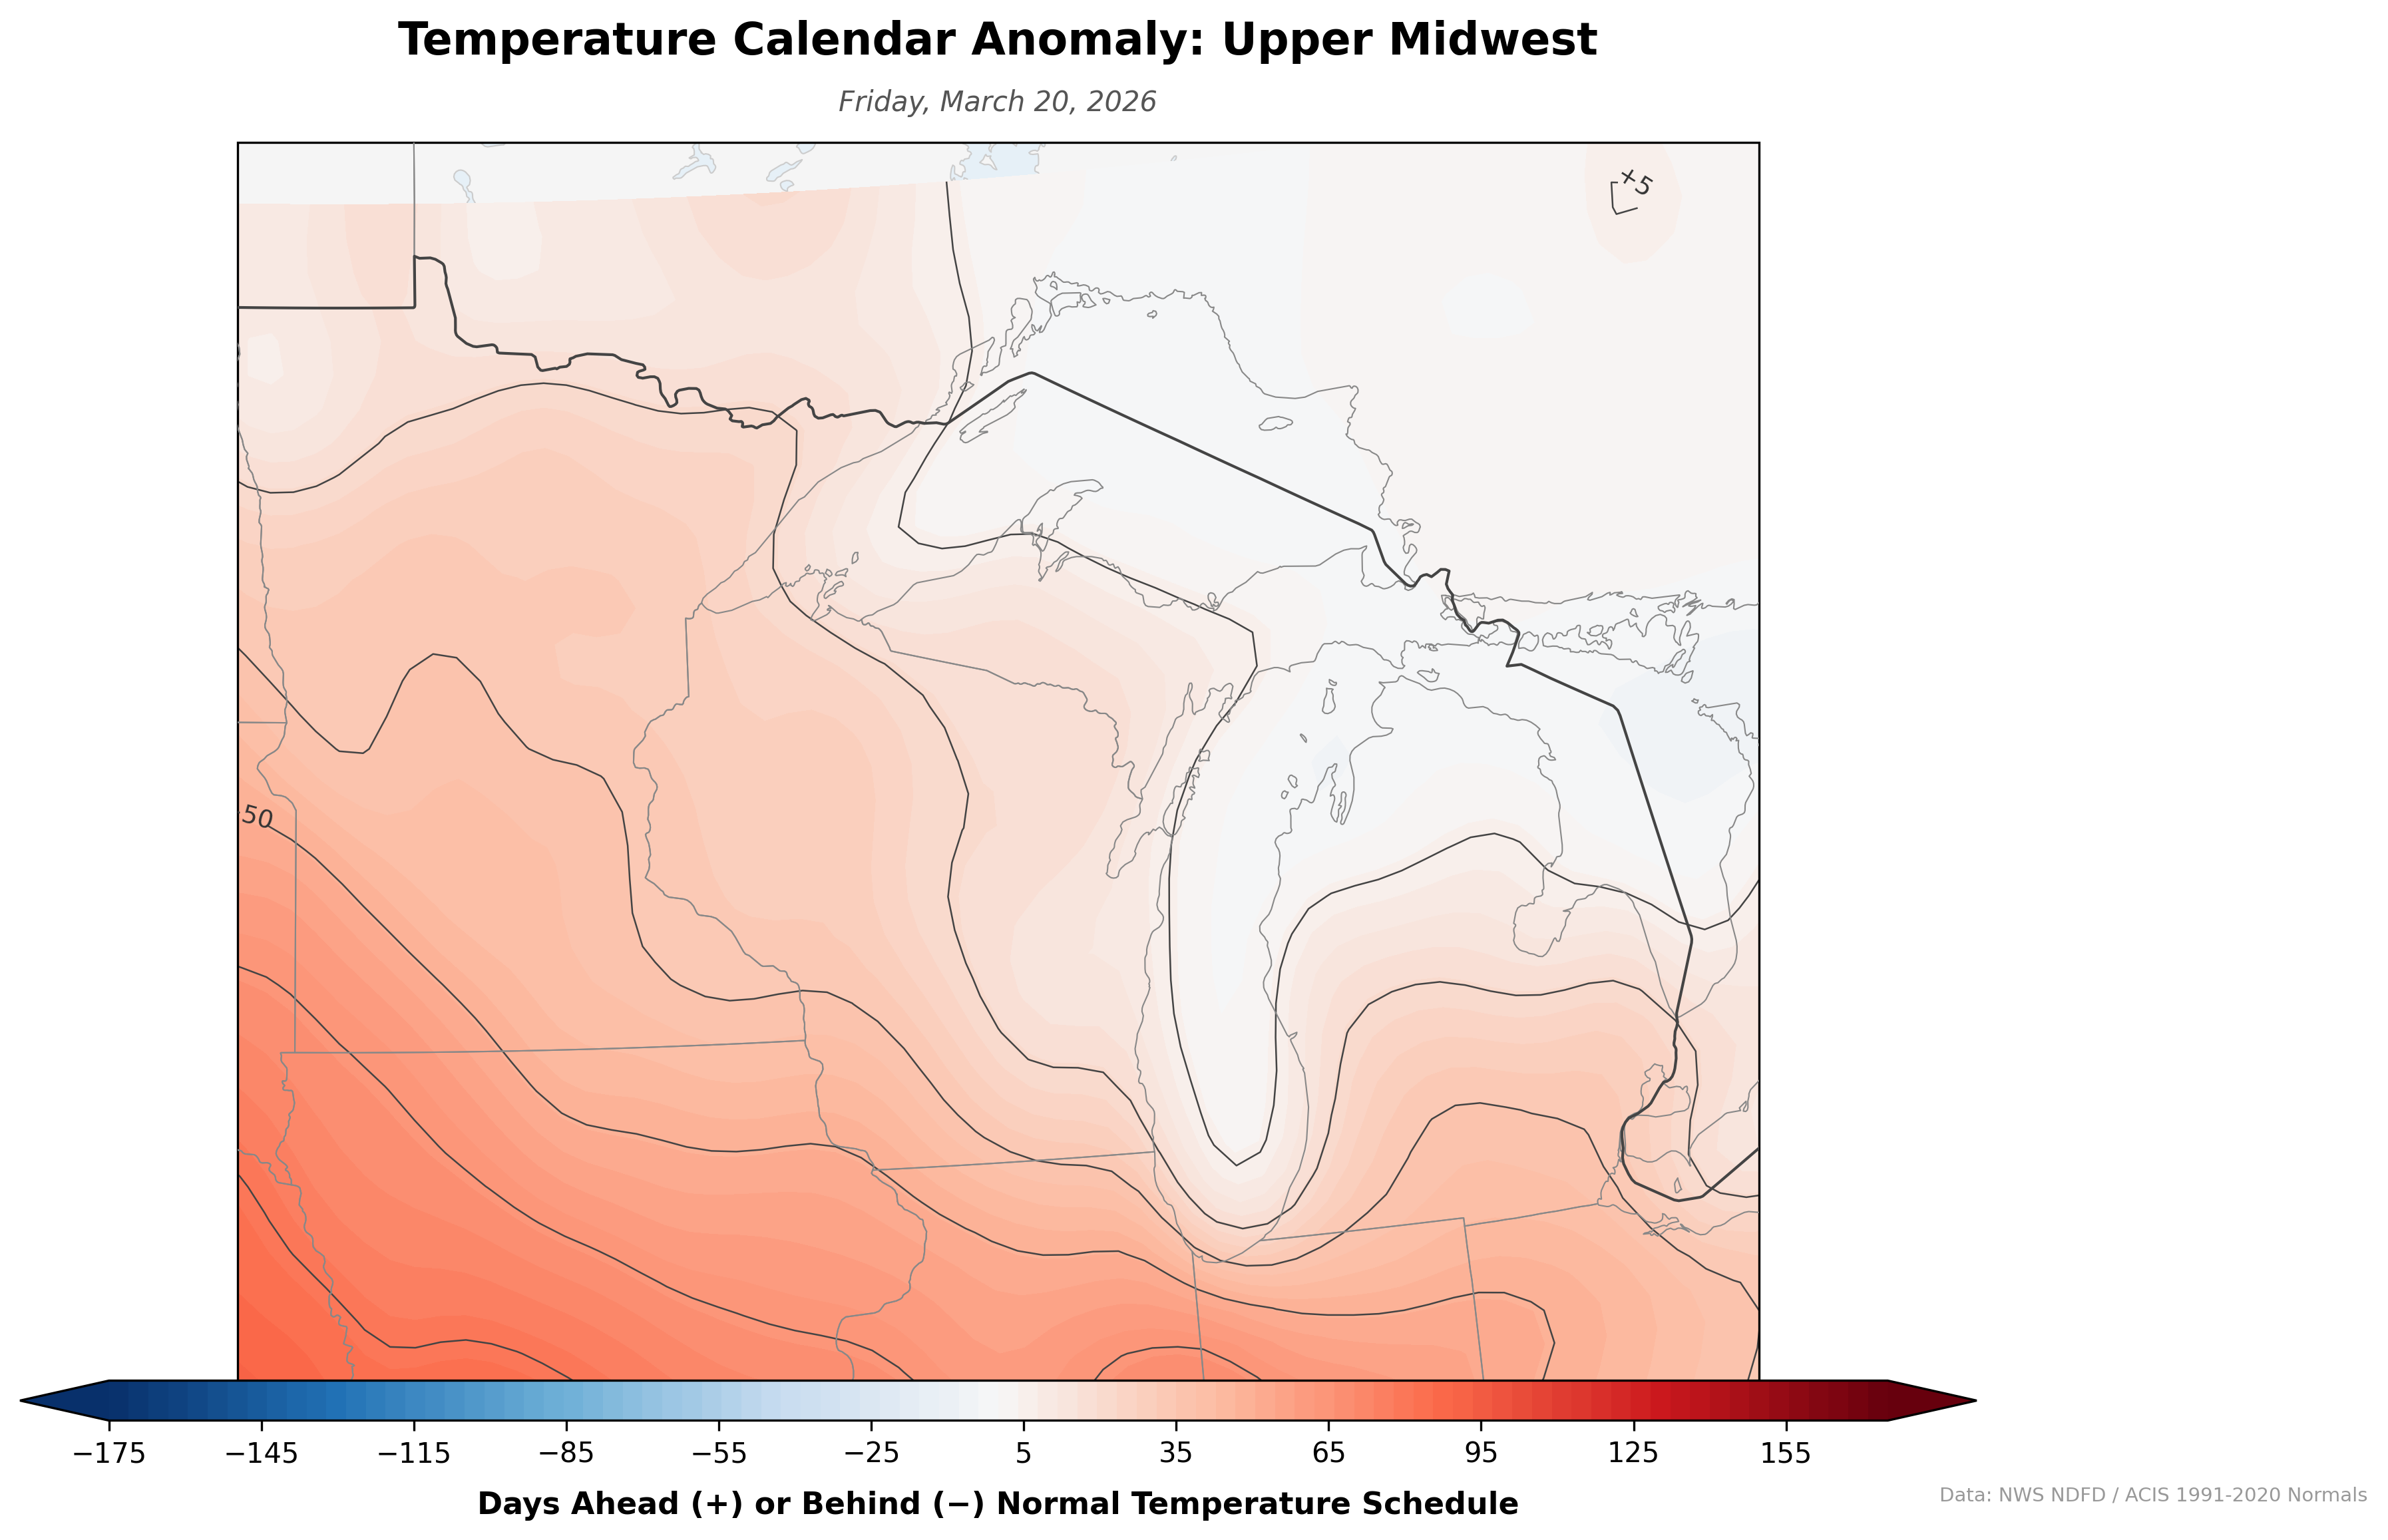
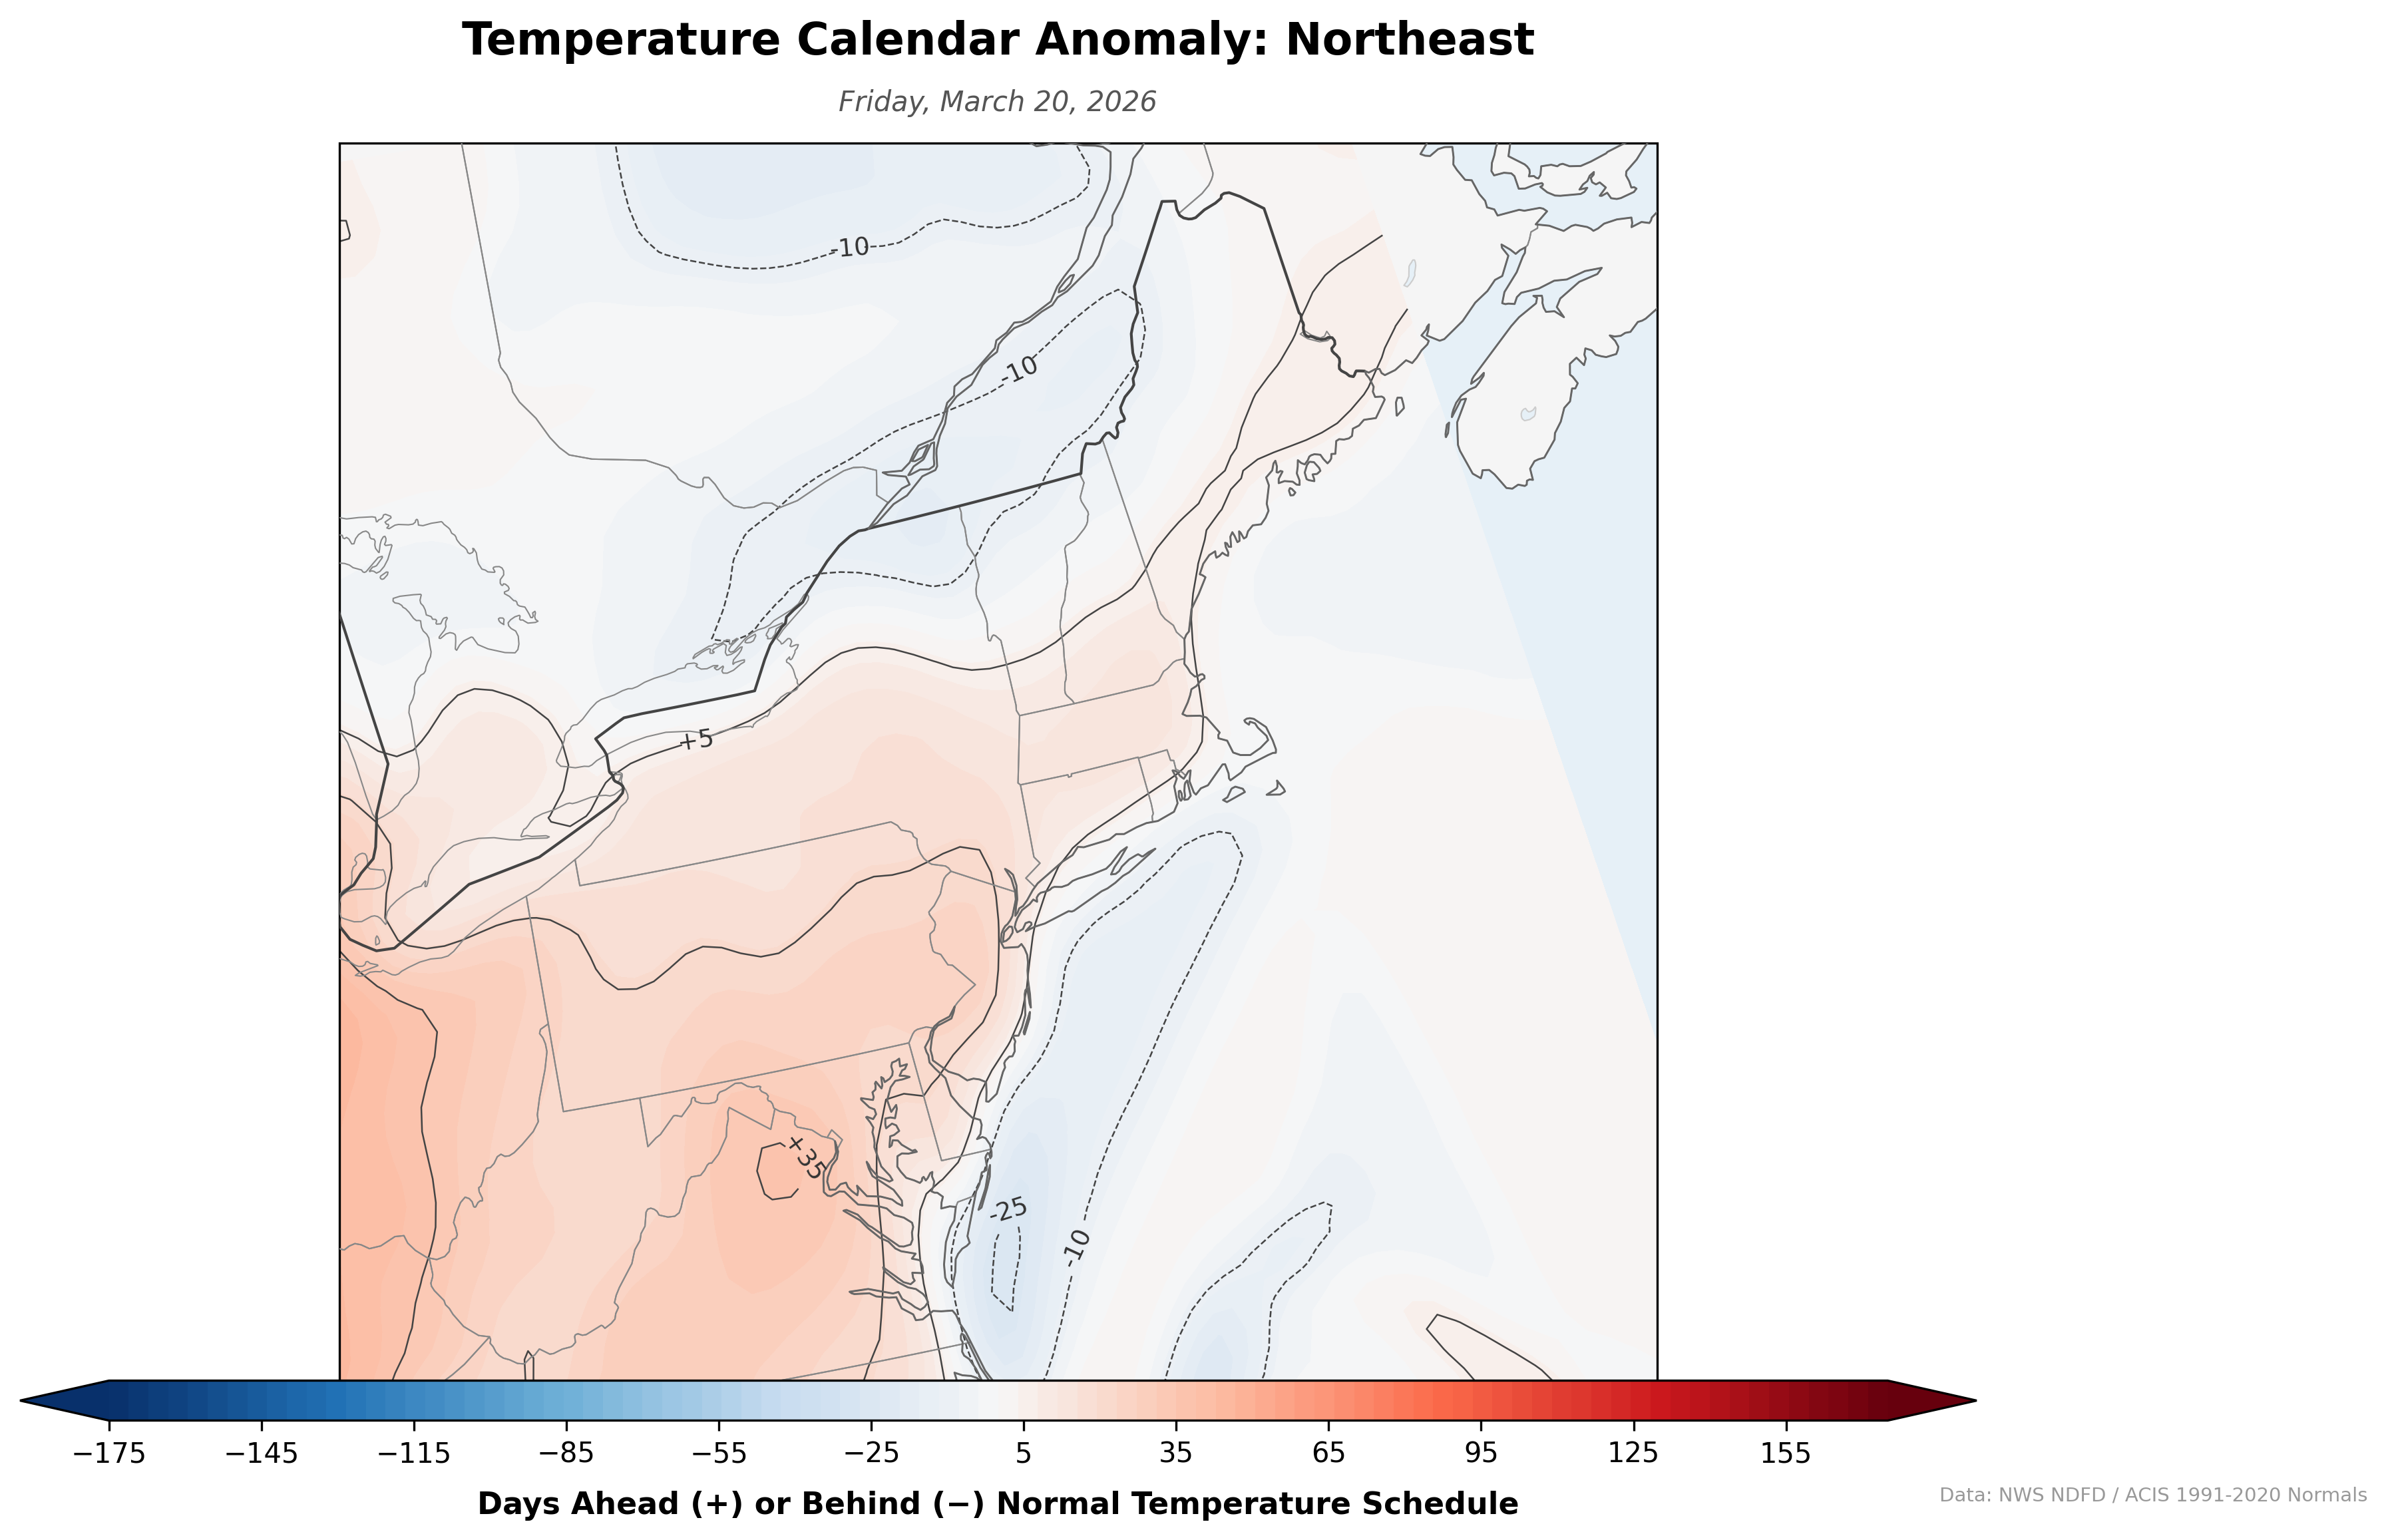
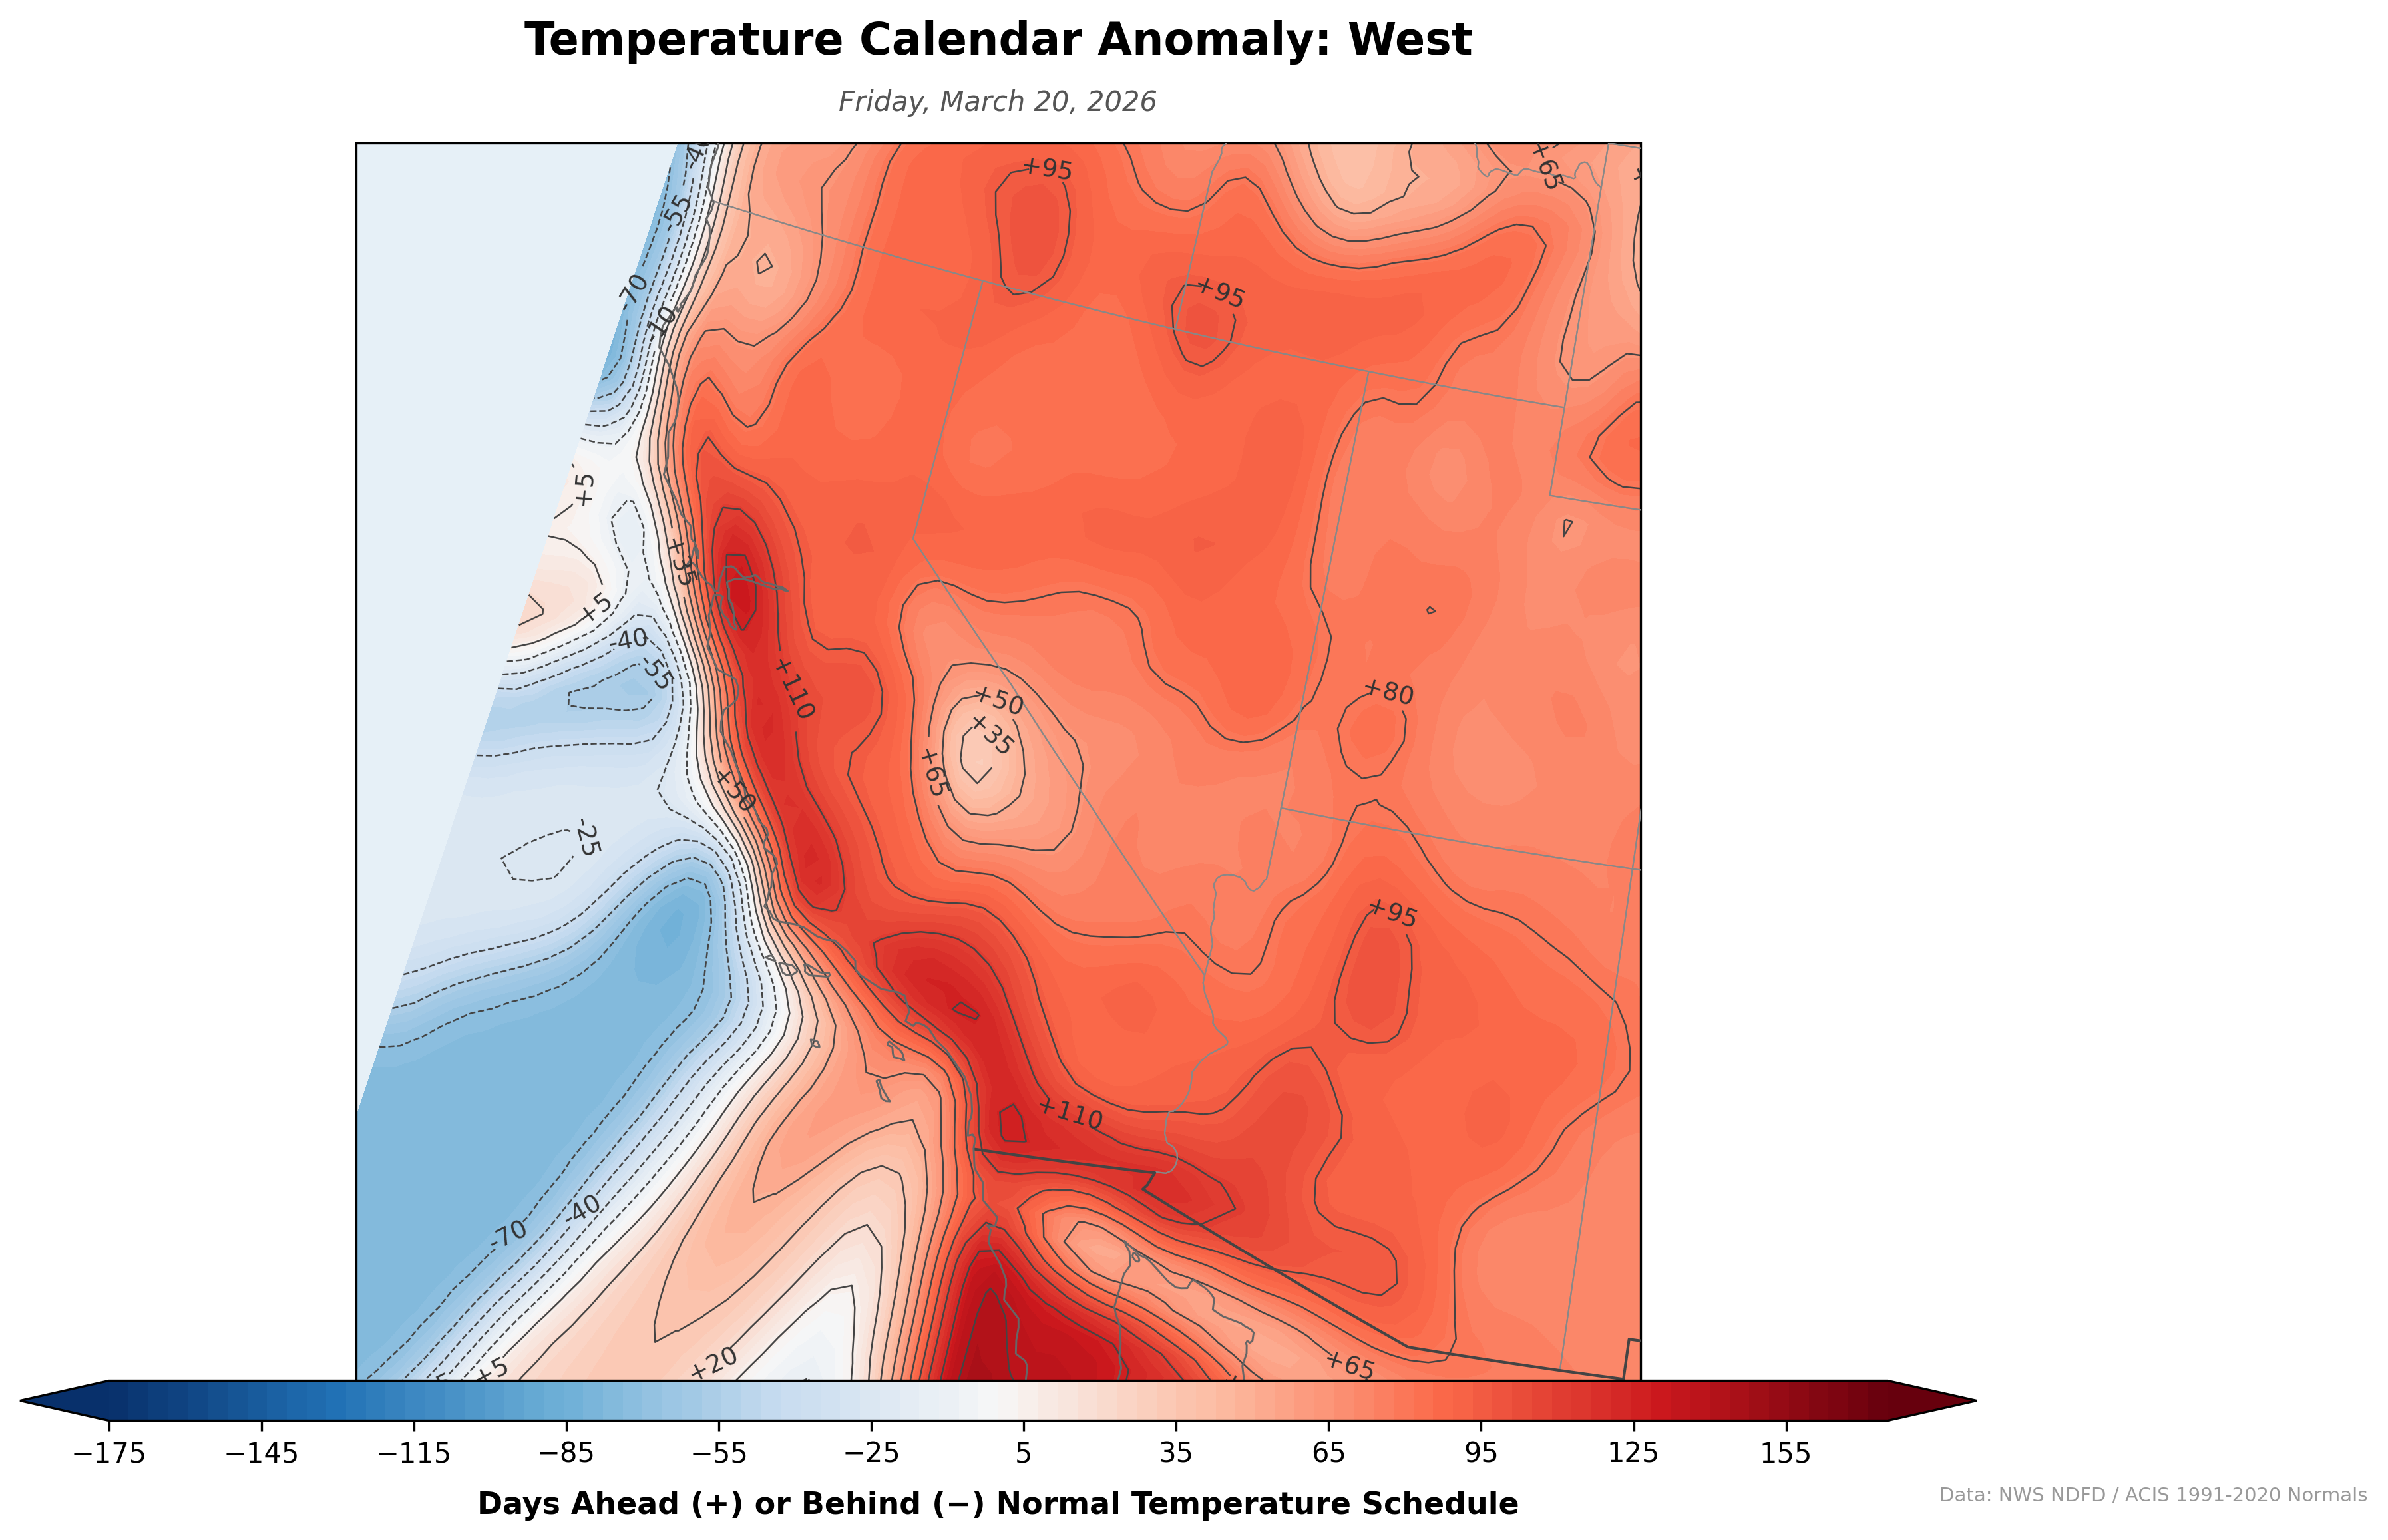
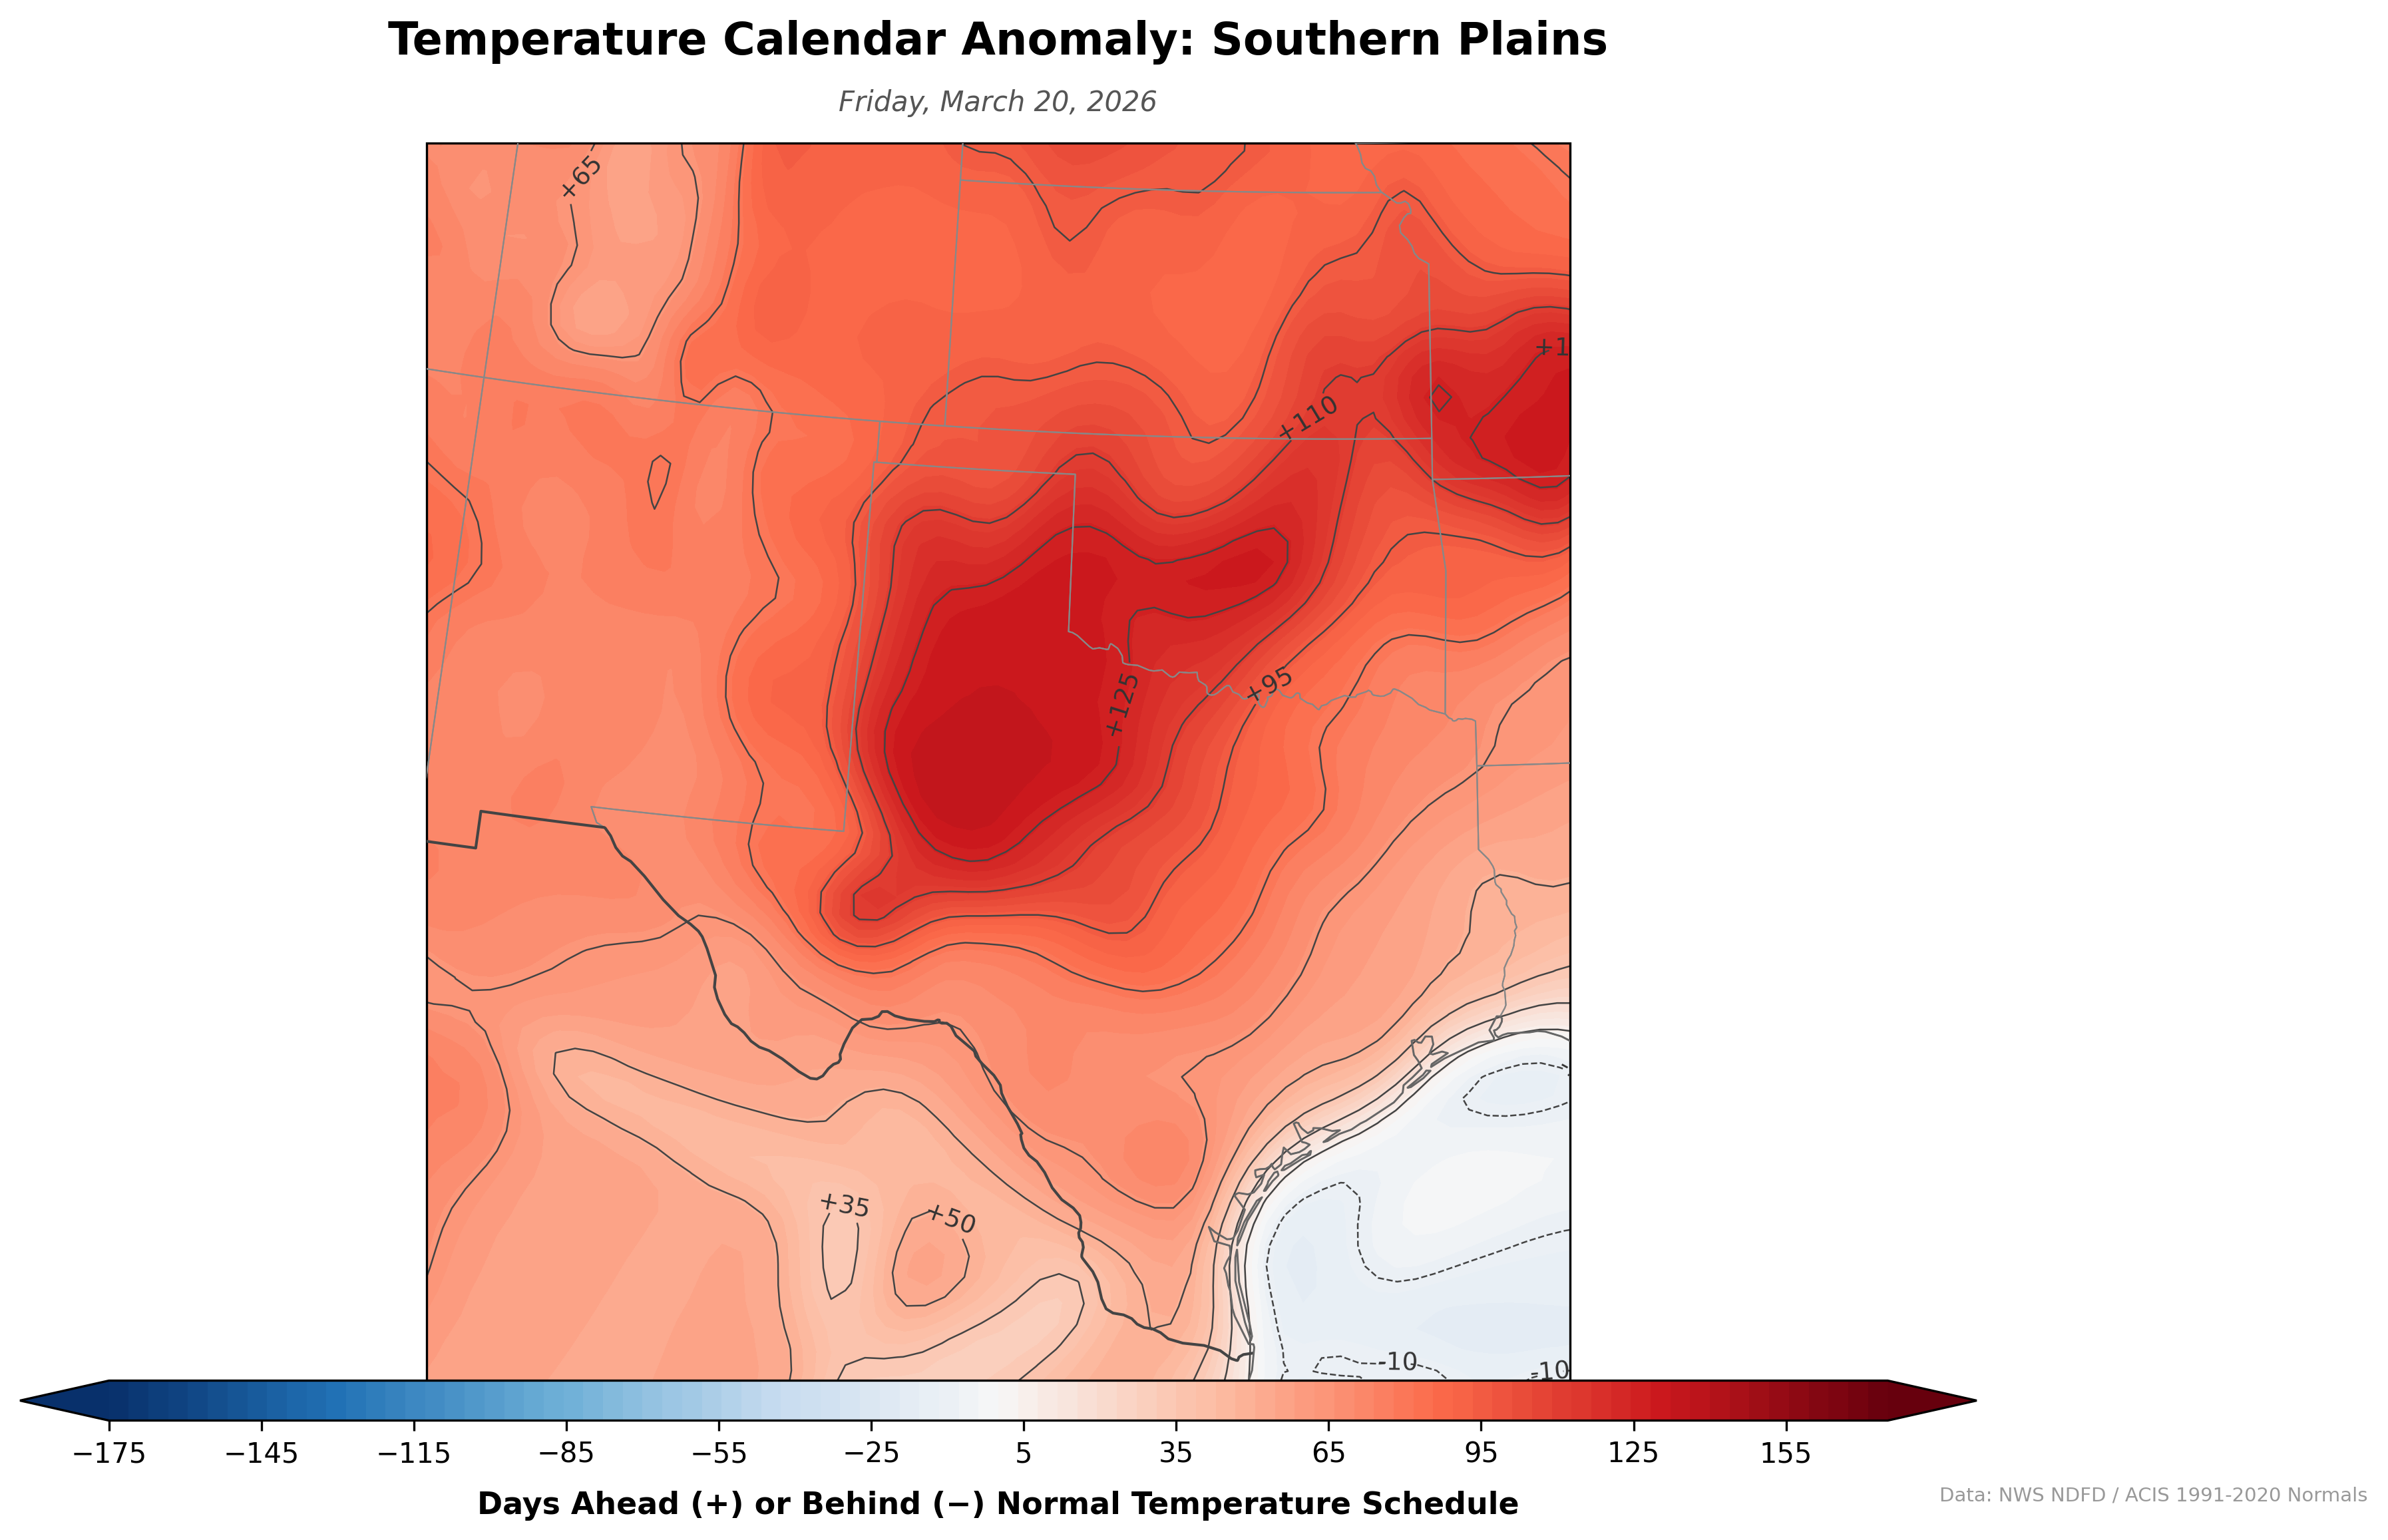
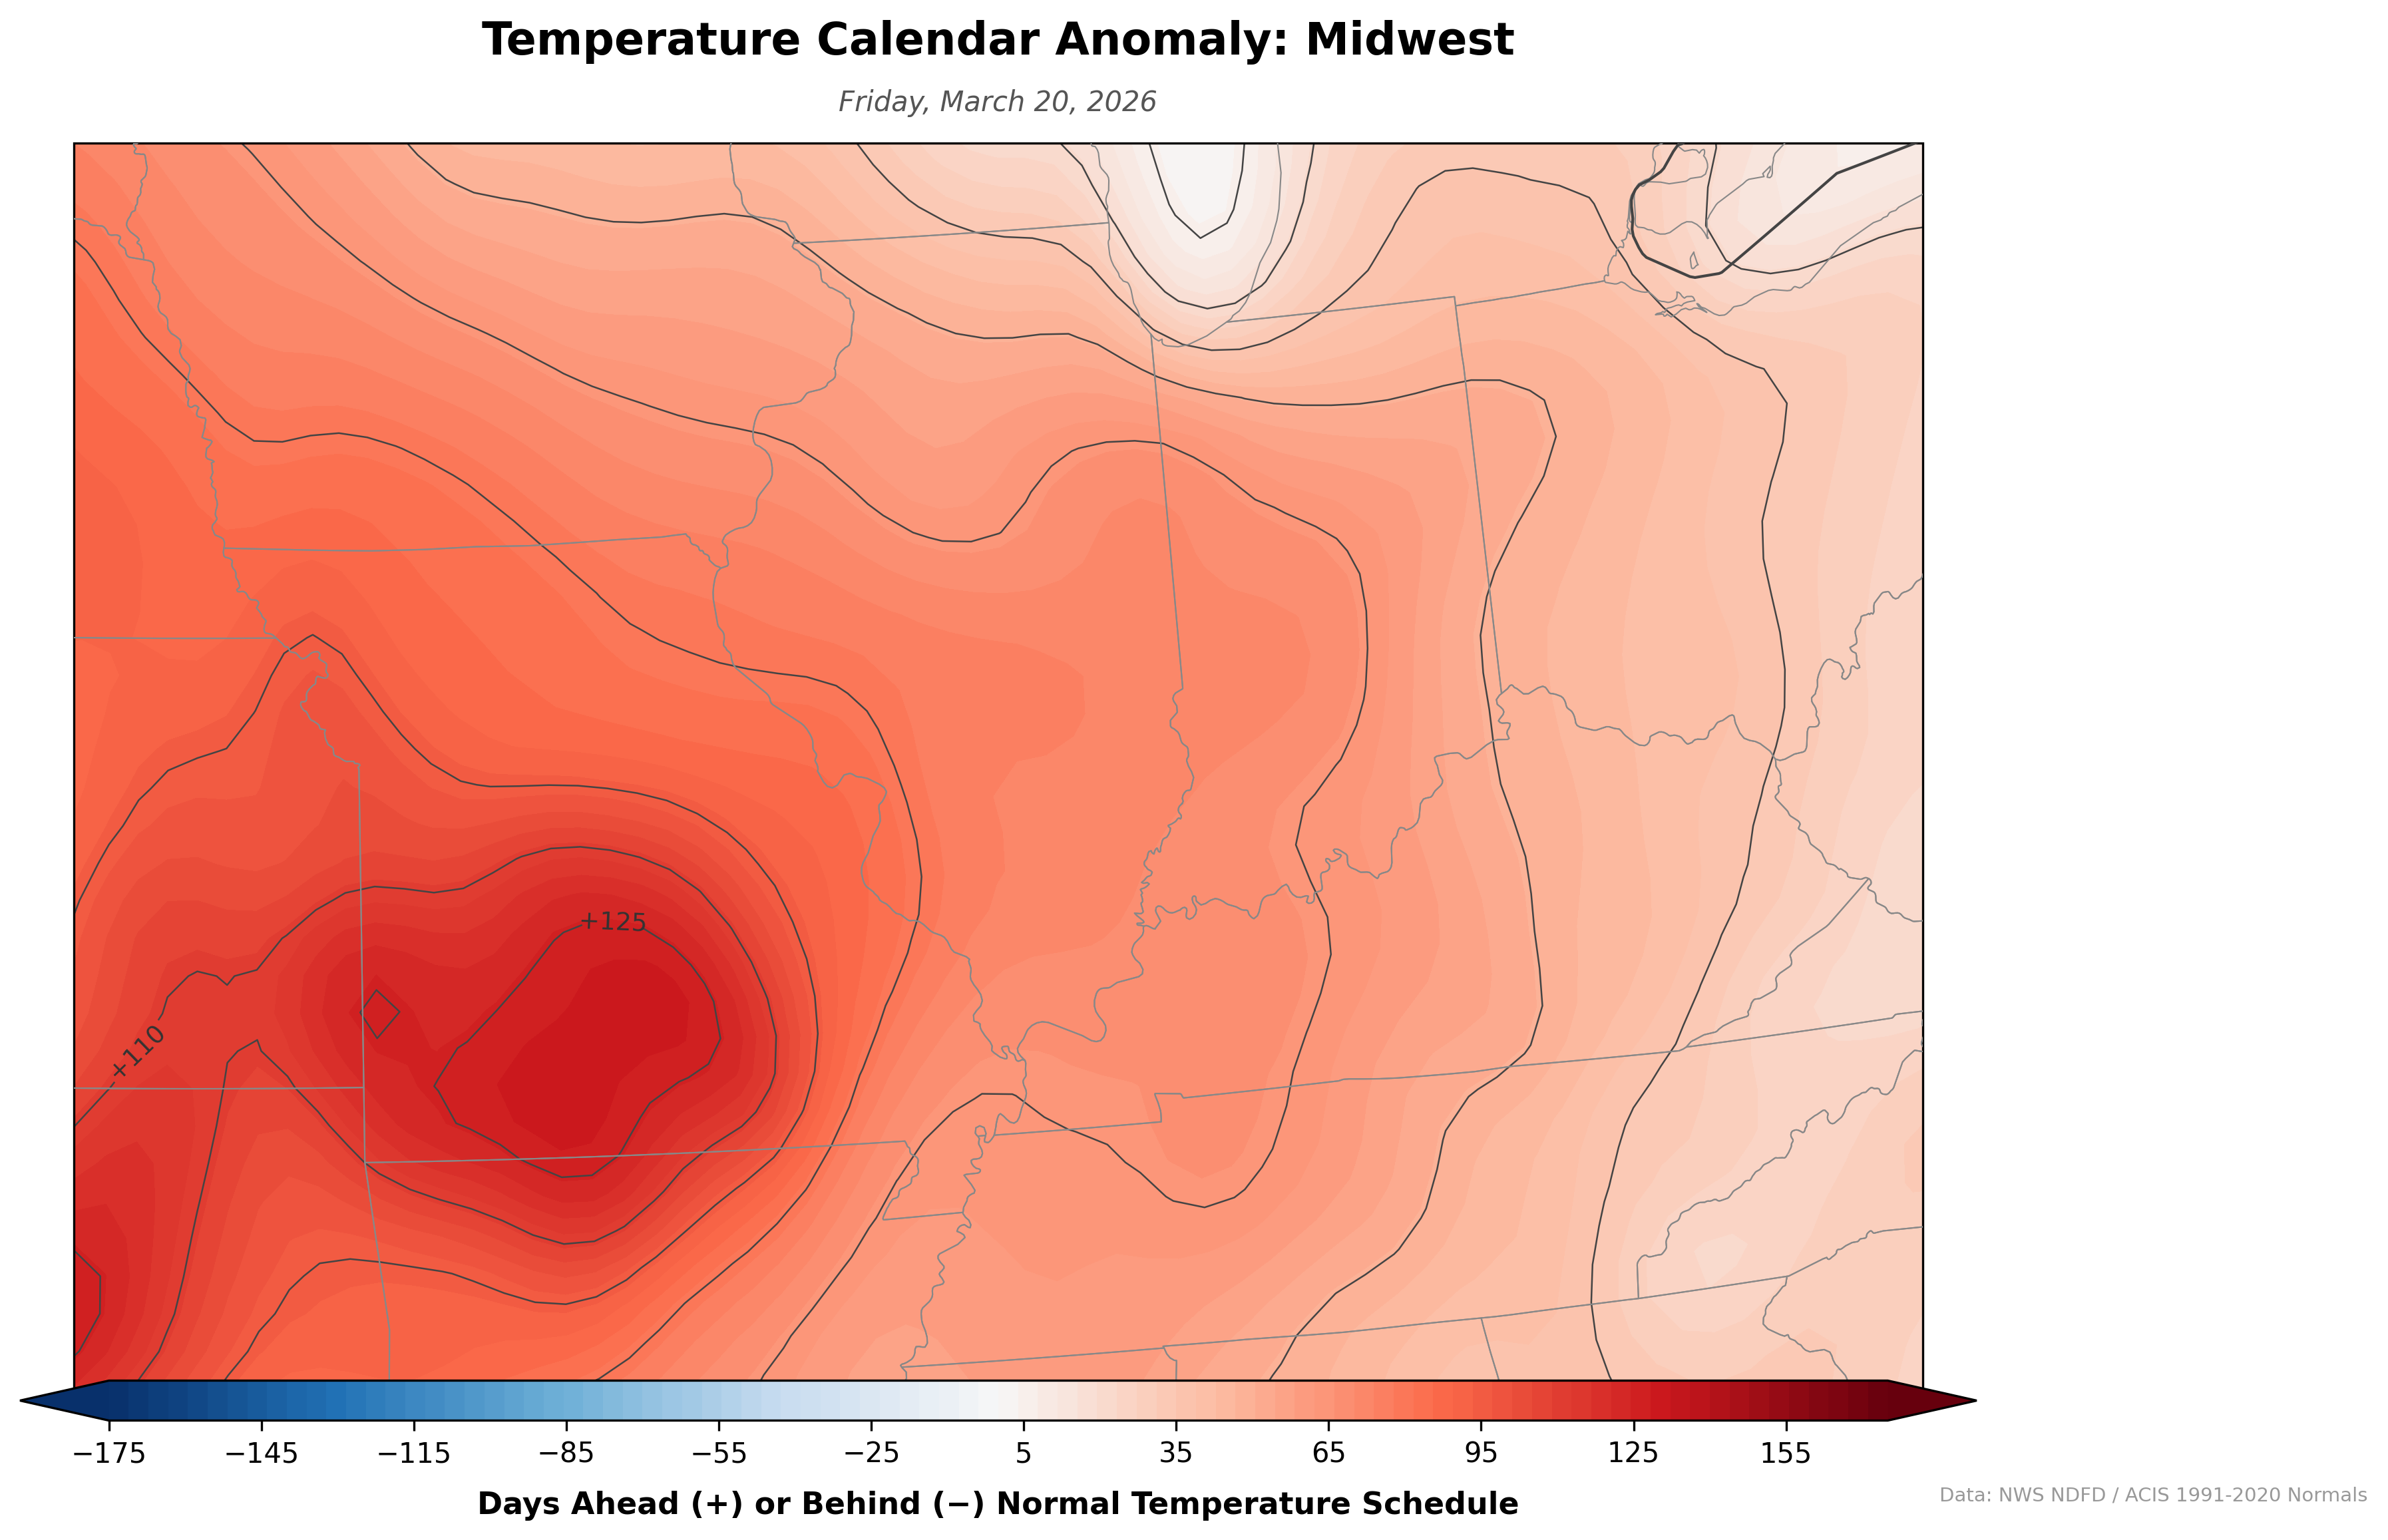
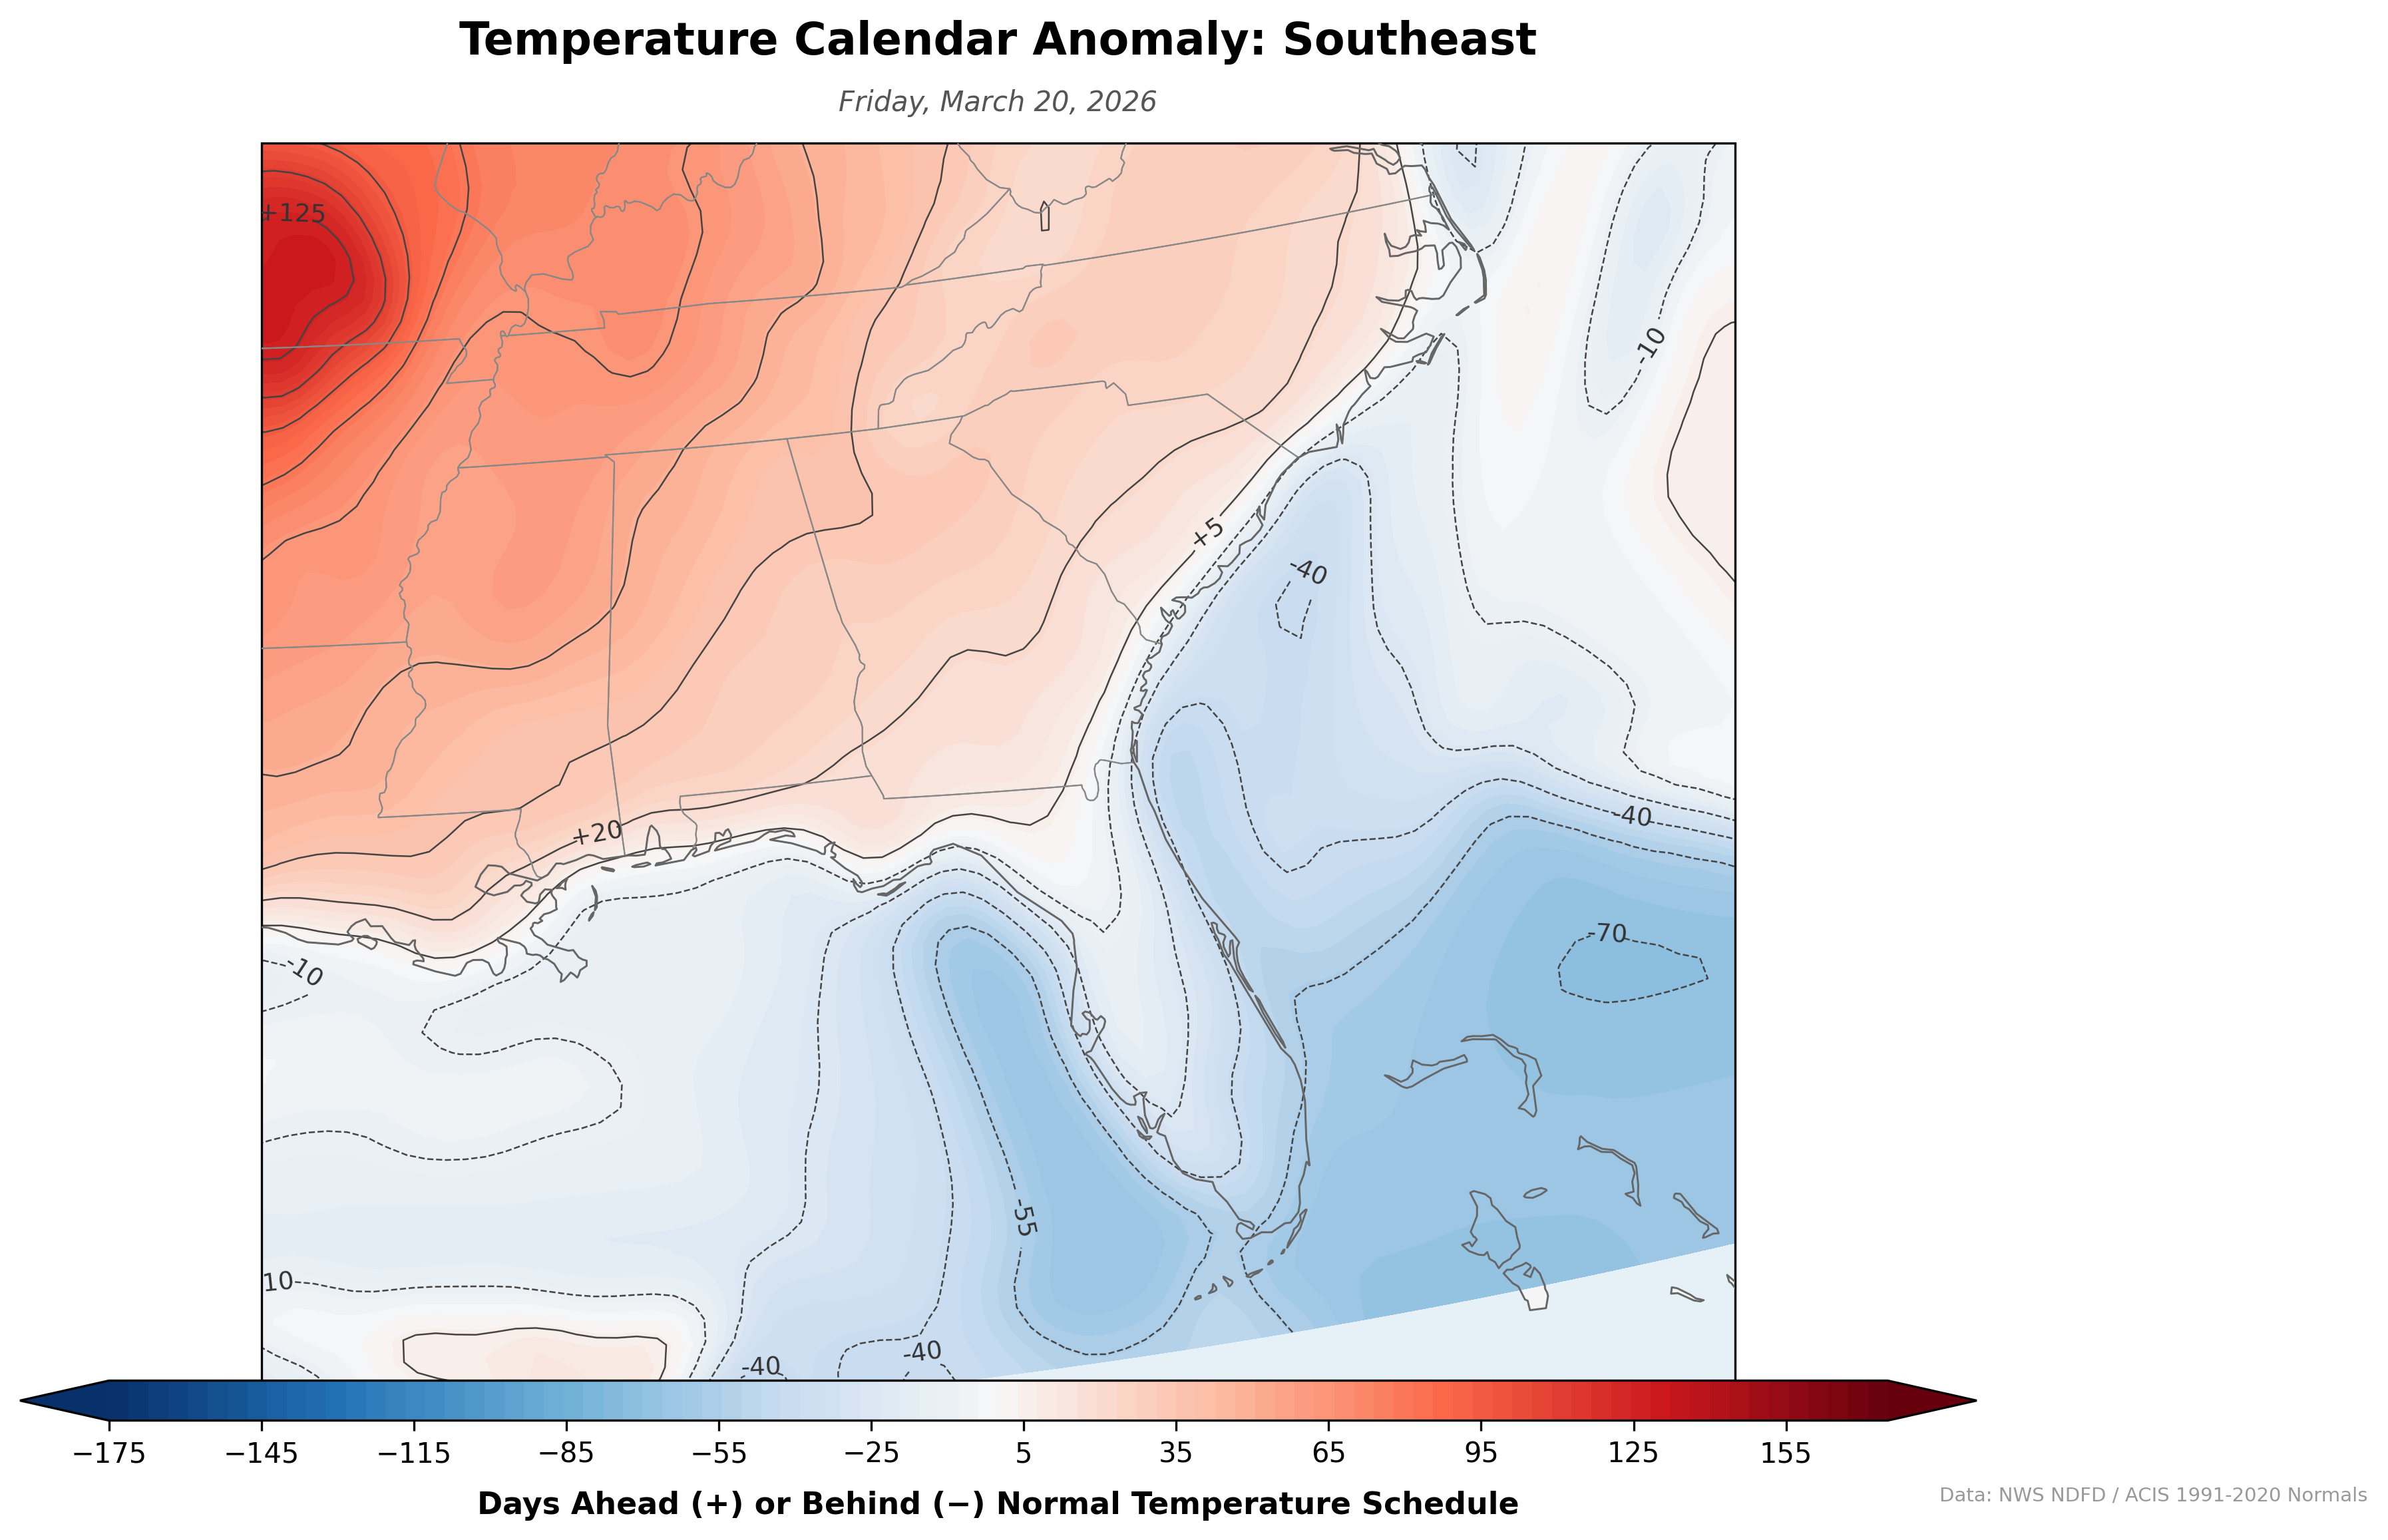
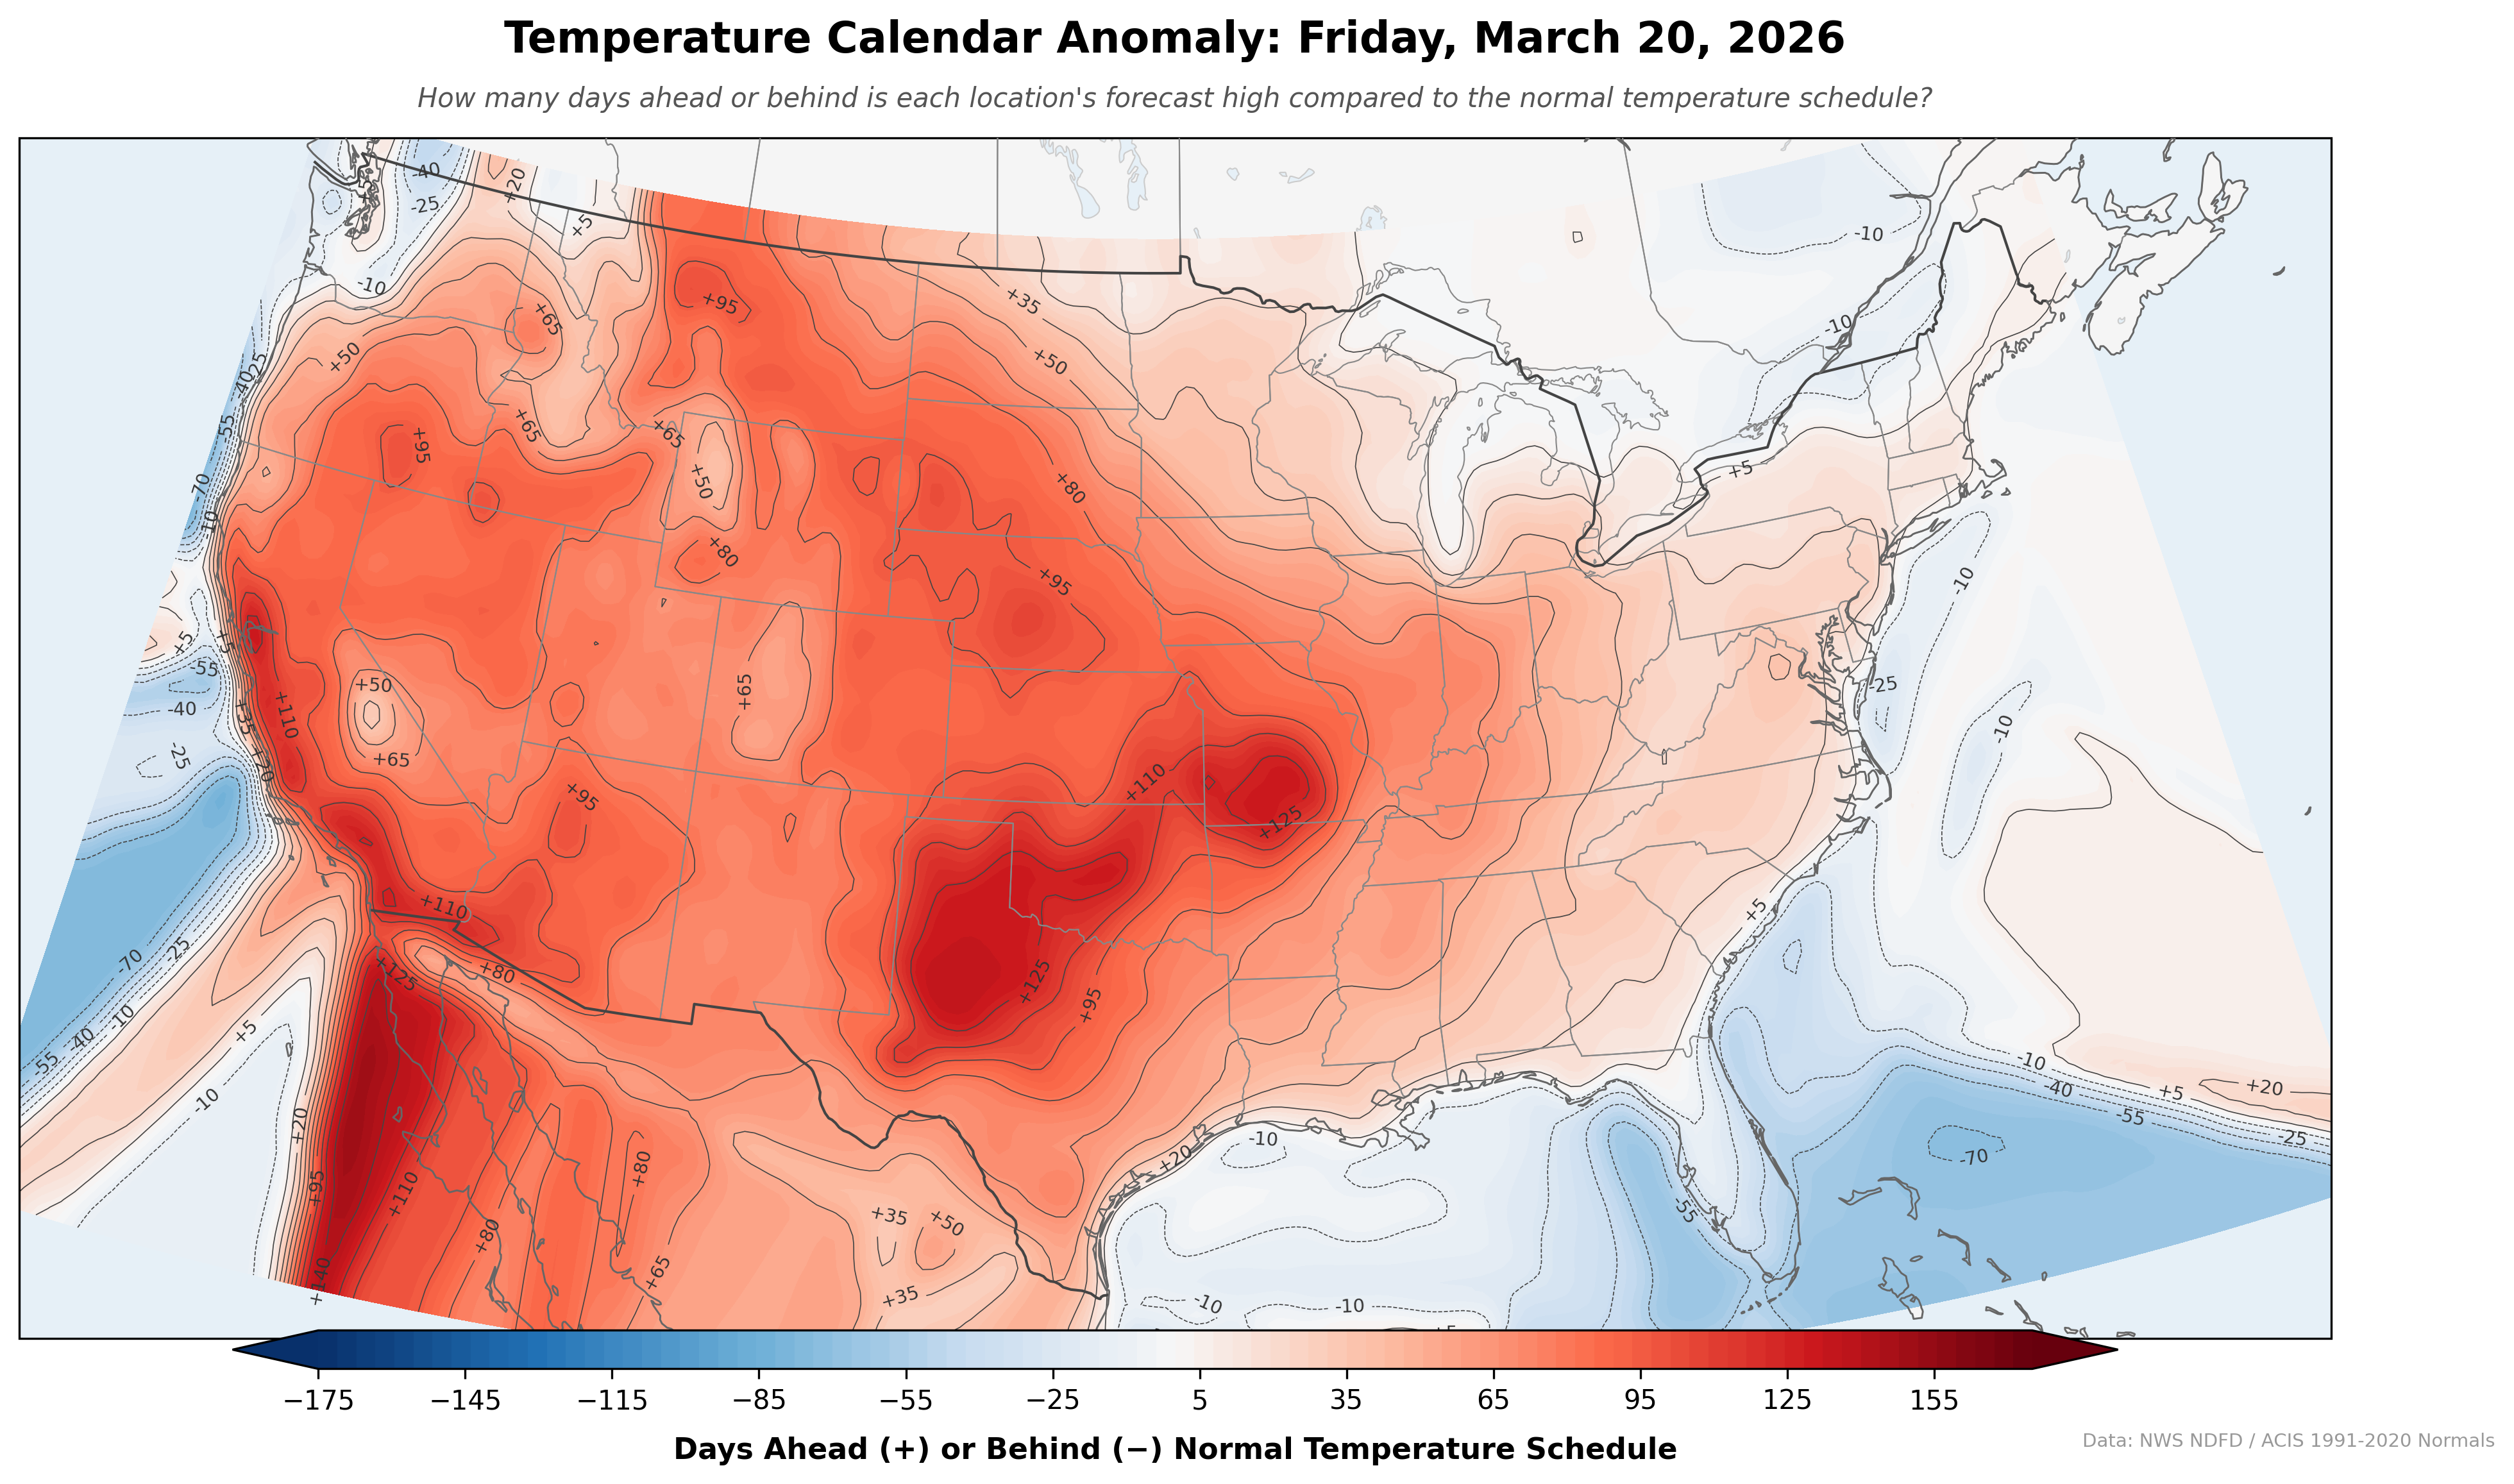
Temperature Calendar Anomaly
A daily-updating map that reframes temperature anomalies as time rather than degrees. Instead of showing "5°F above normal," it shows how many days ahead or behind the normal temperature schedule each location is. If the forecast high for July 1 matches the climatological normal for July 15, that spot shows +14 days — two weeks ahead of schedule.
Click the map for full resolution.
This is an independent project and is not an official product of the National Weather Service or NOAA. Data: NWS NDFD forecast highs / RCC-ACIS 1991–2020 daily normals.
Browse ArchiveRegional Views
Click any region for a full-resolution crop.