Alex Cooke
Research
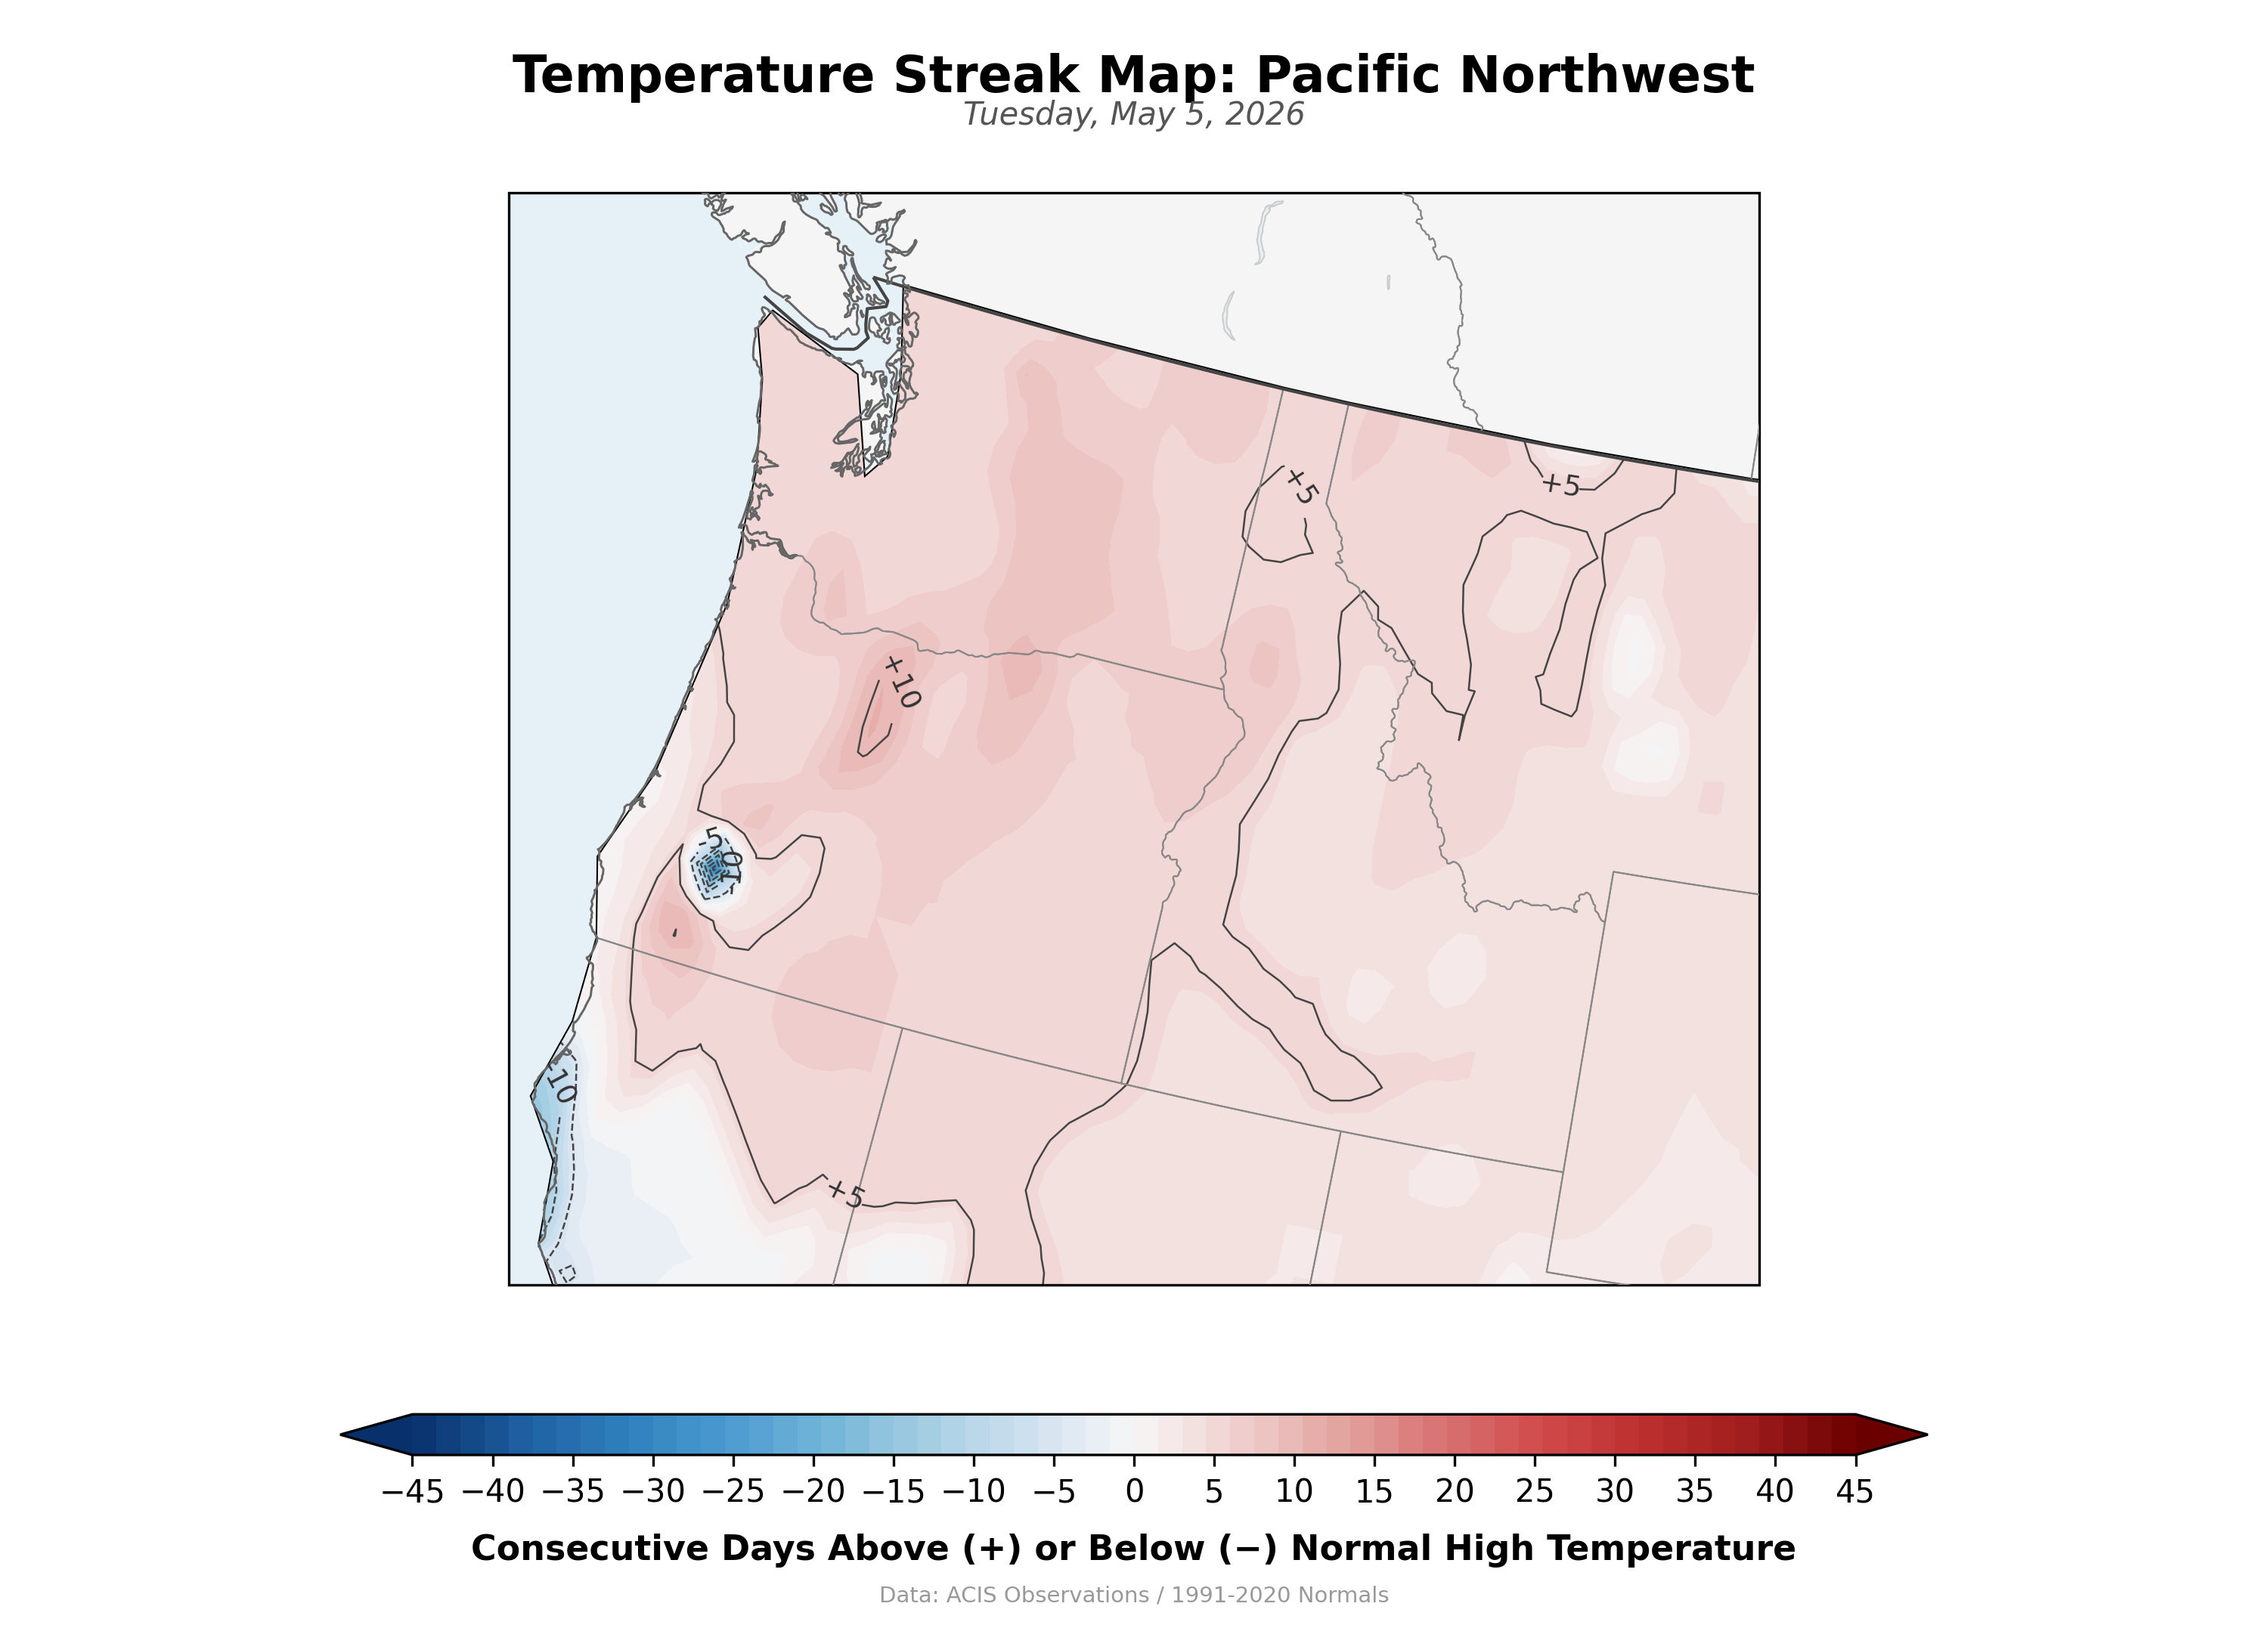
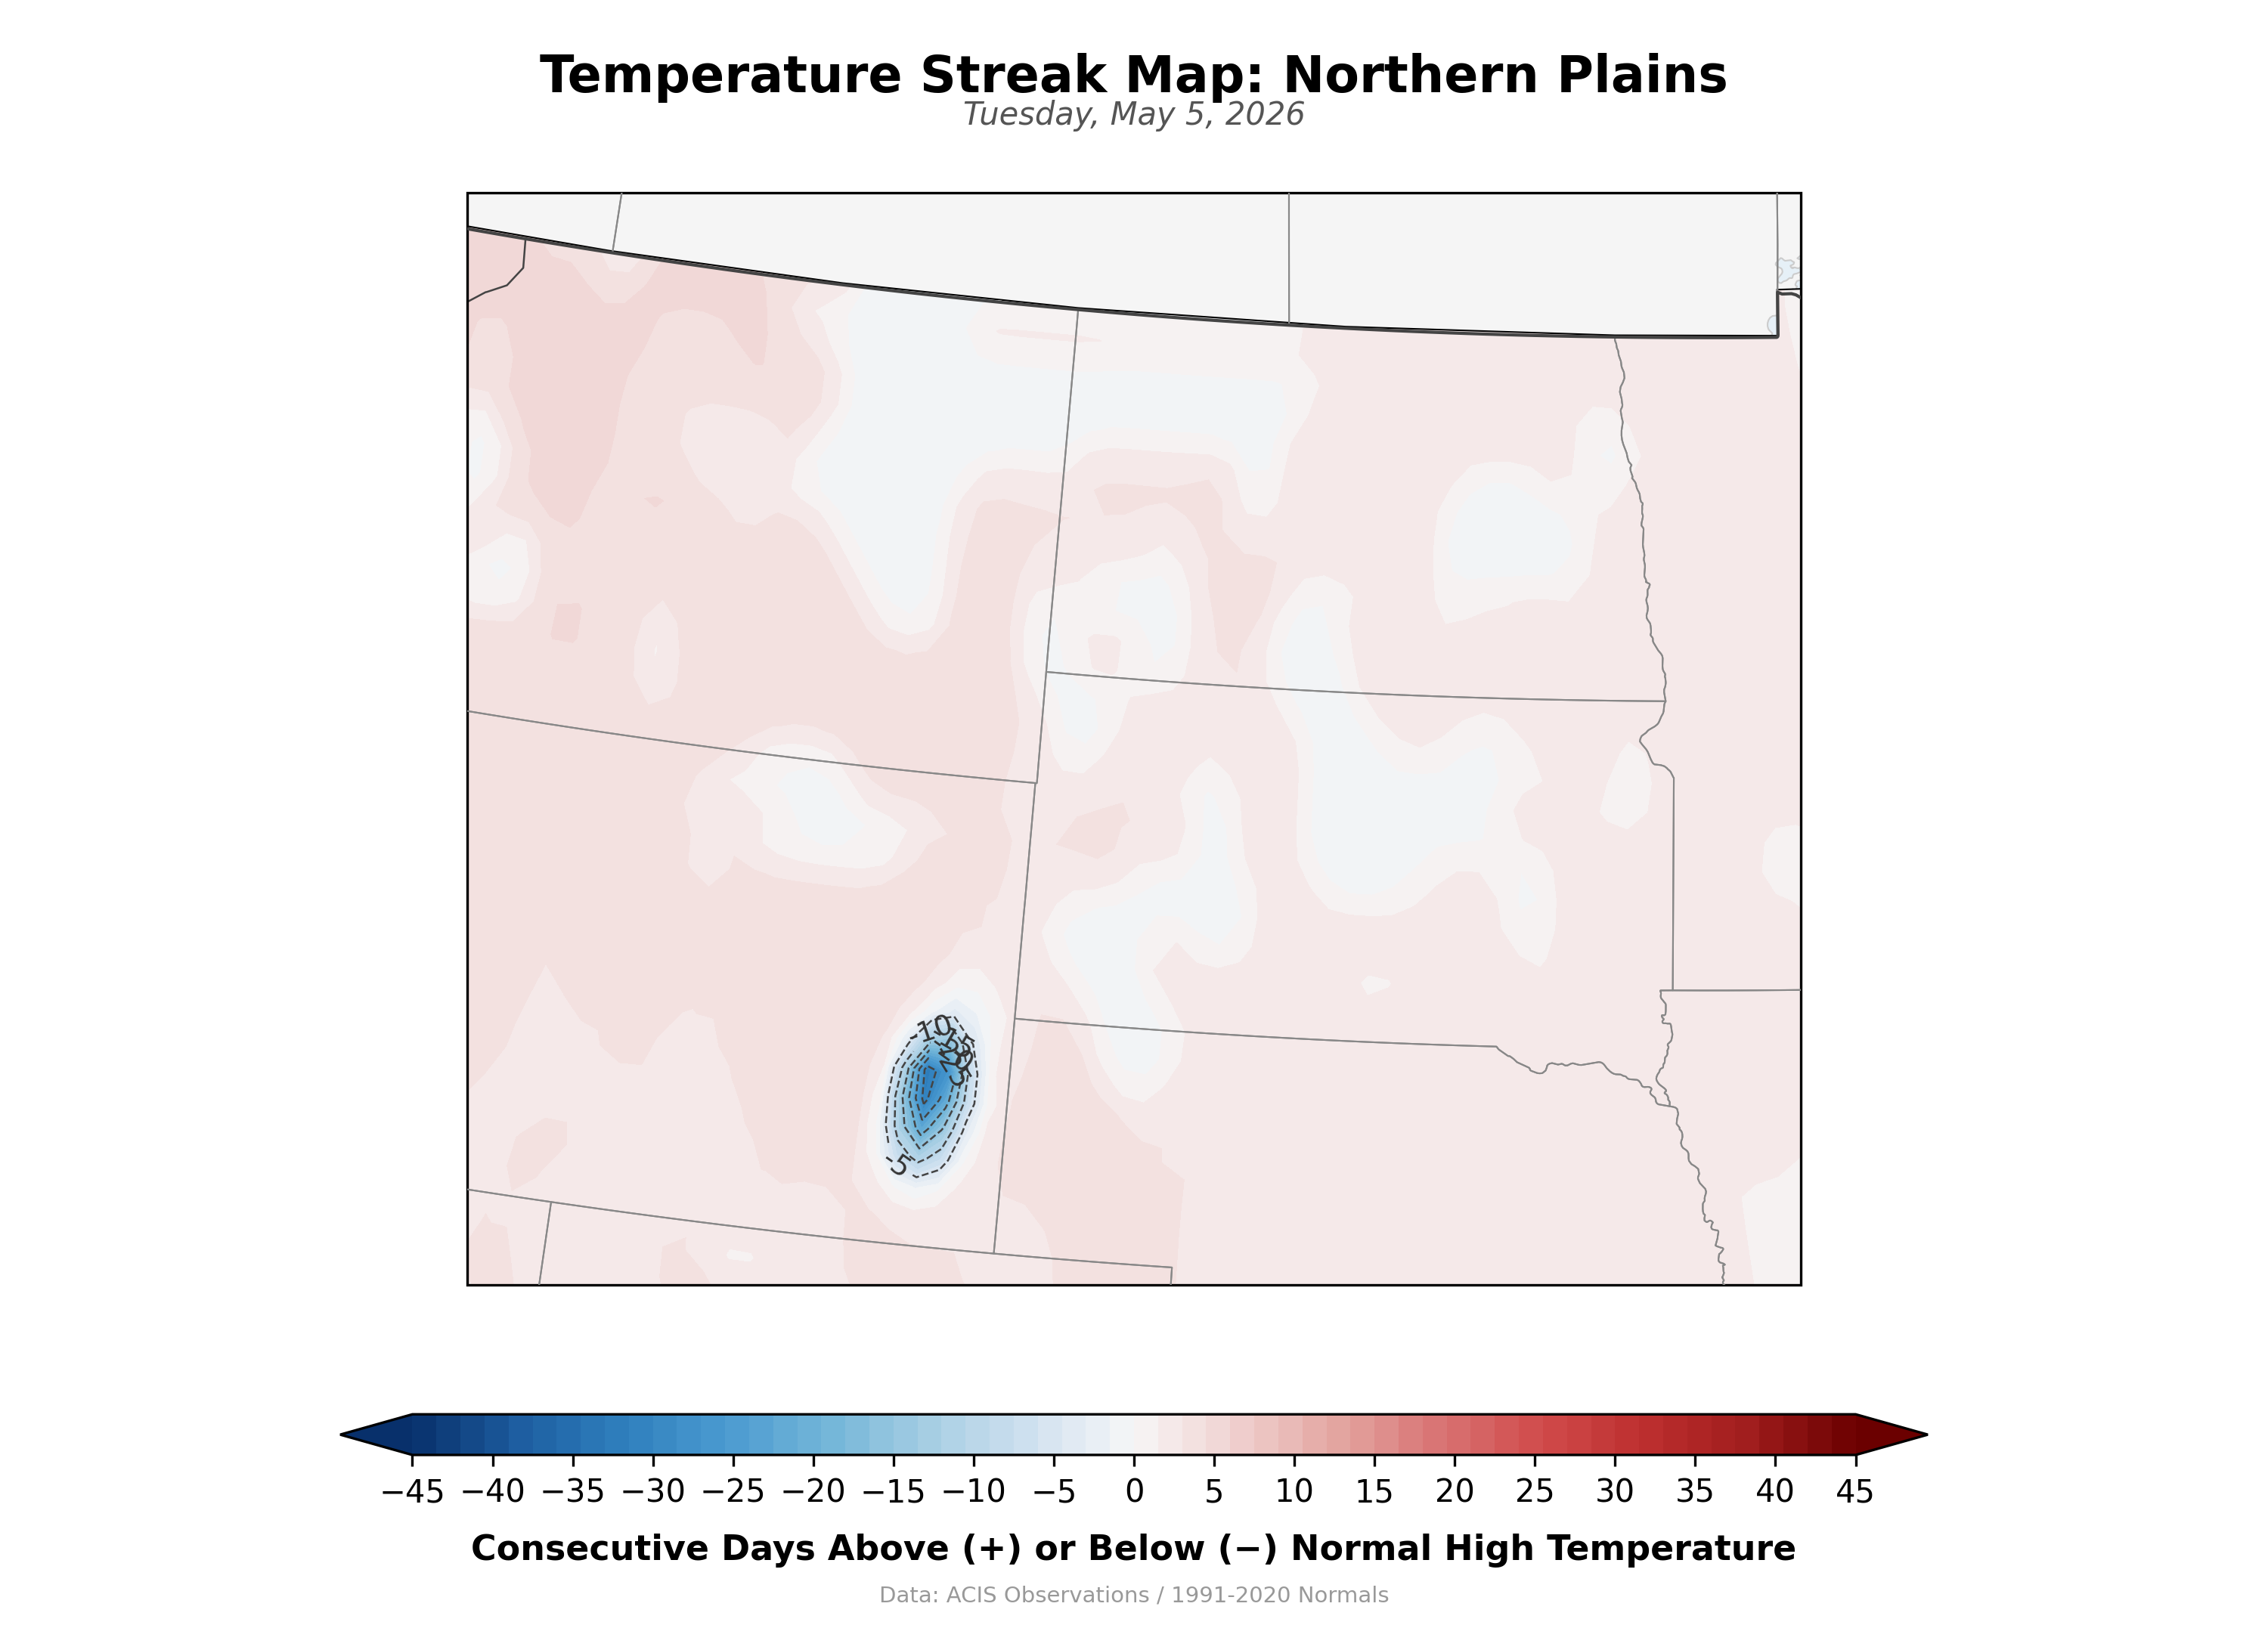
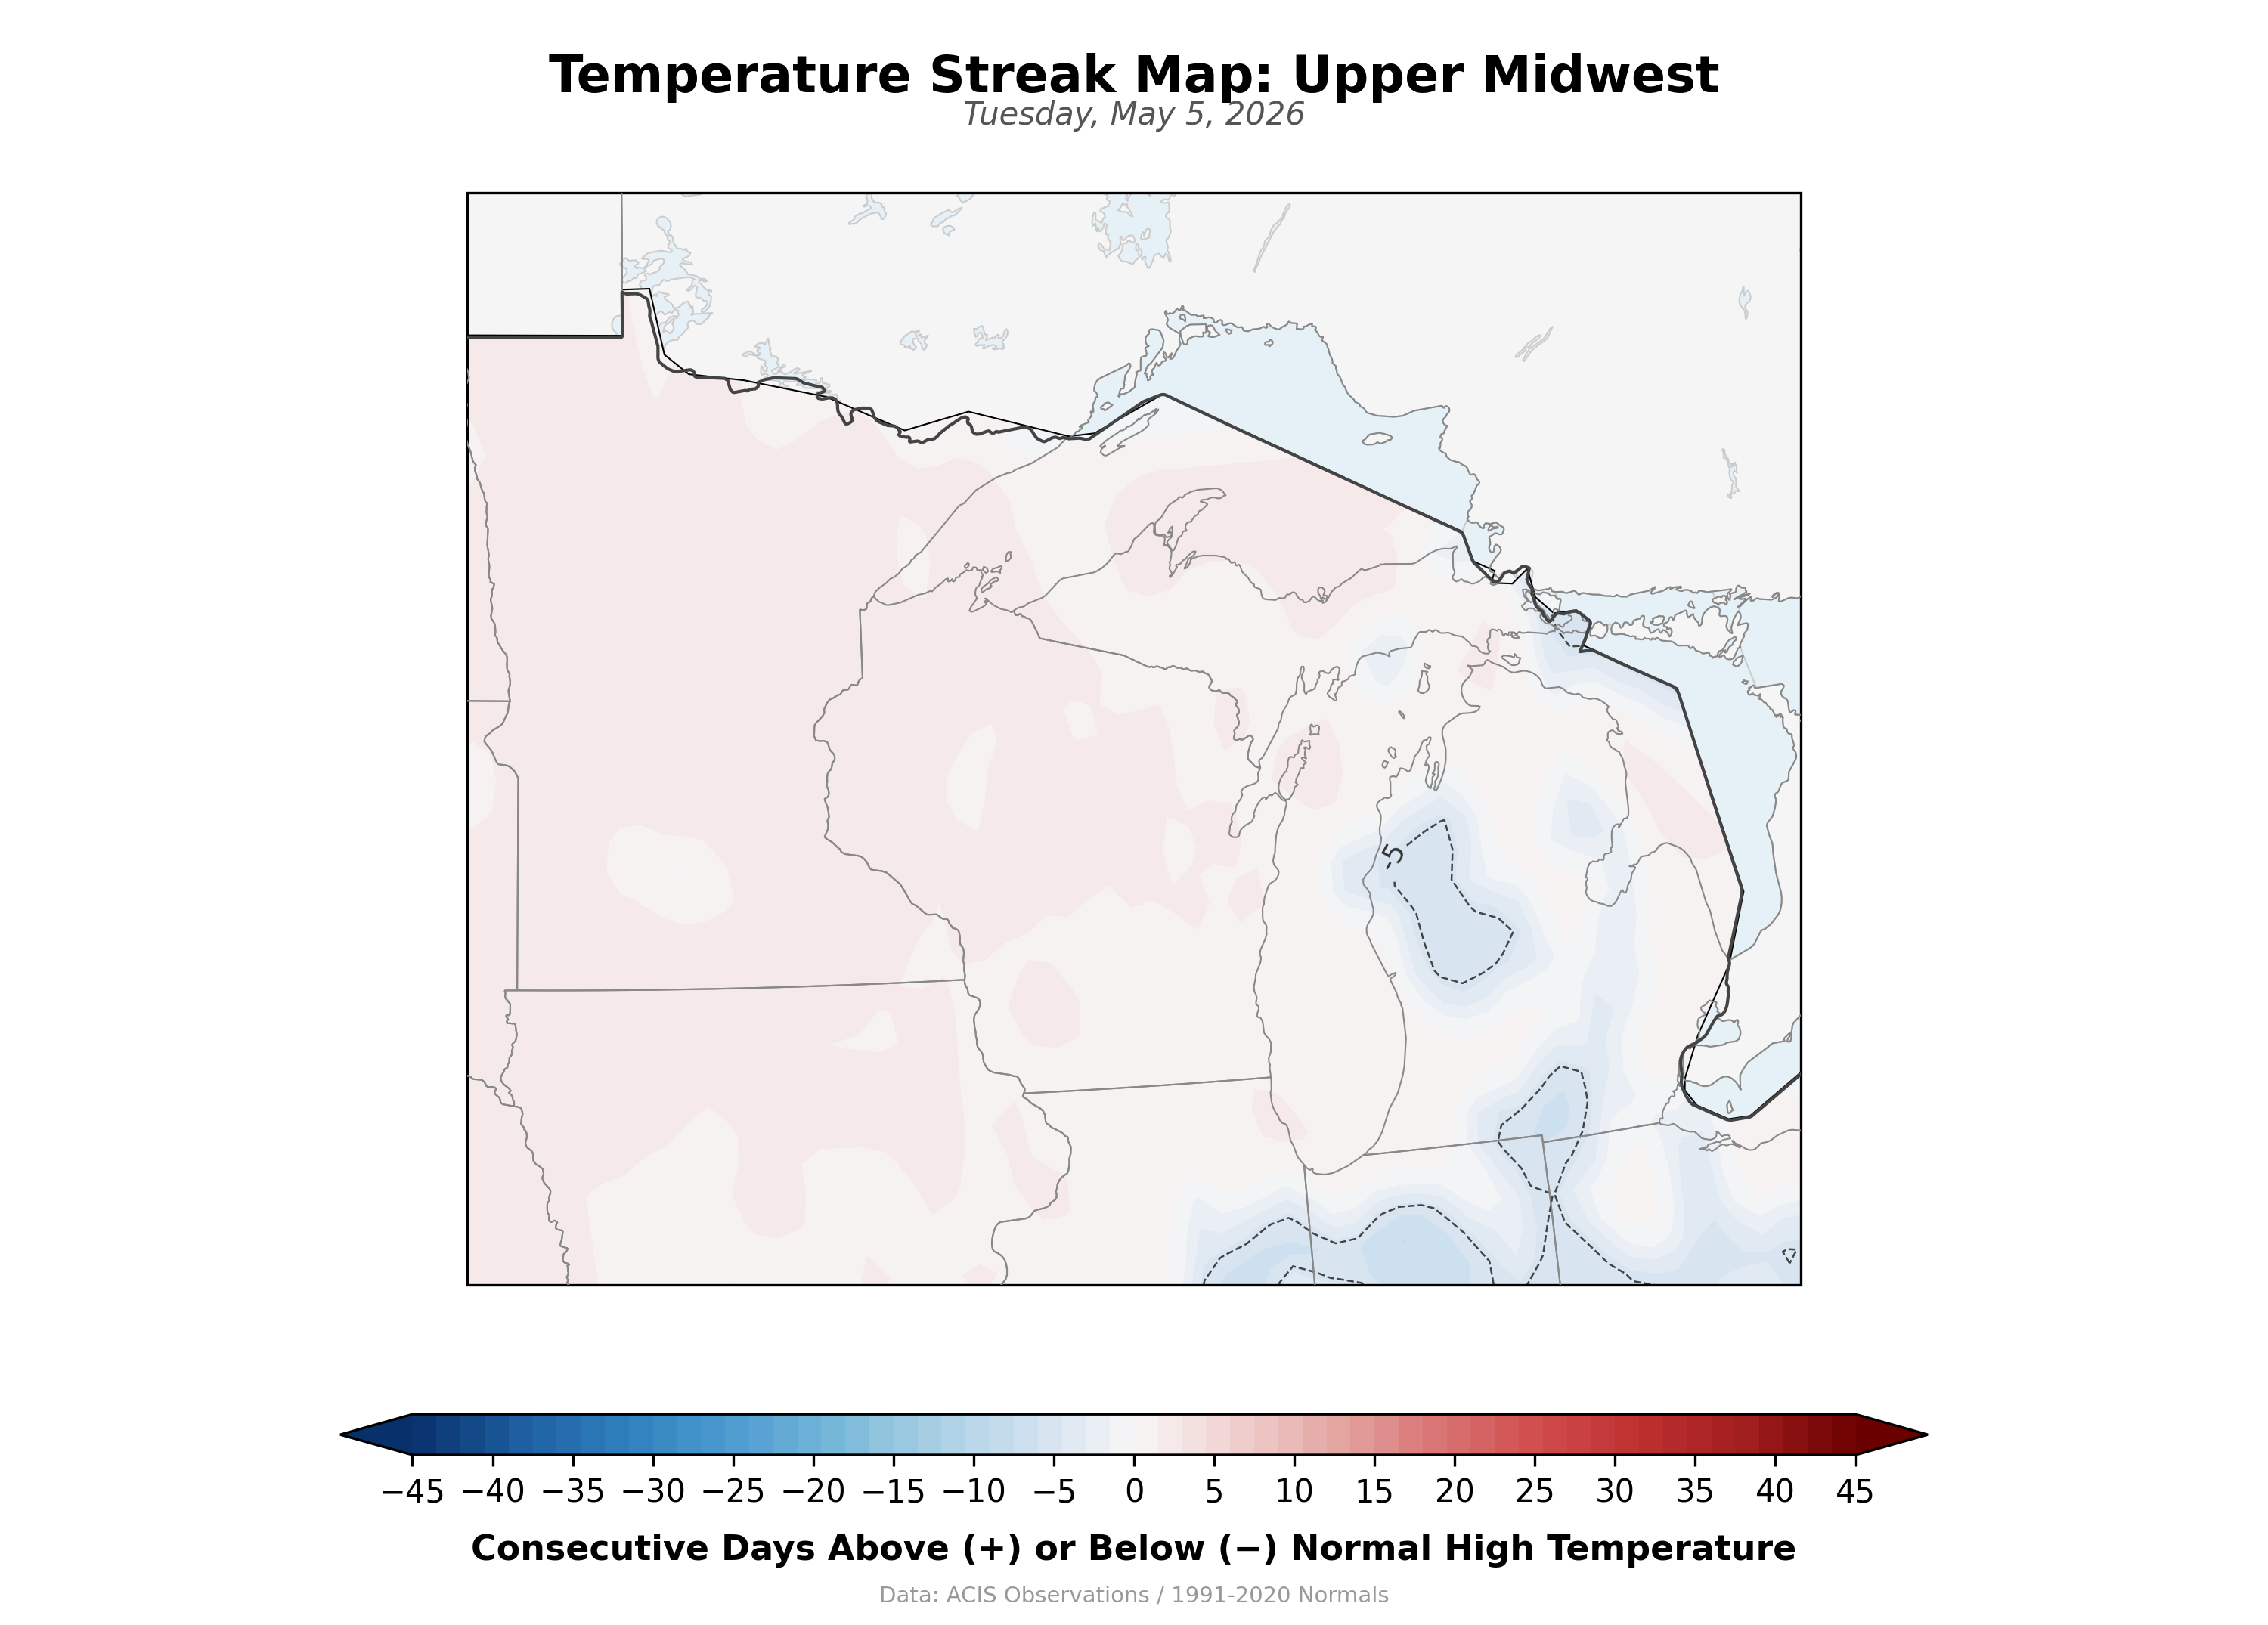
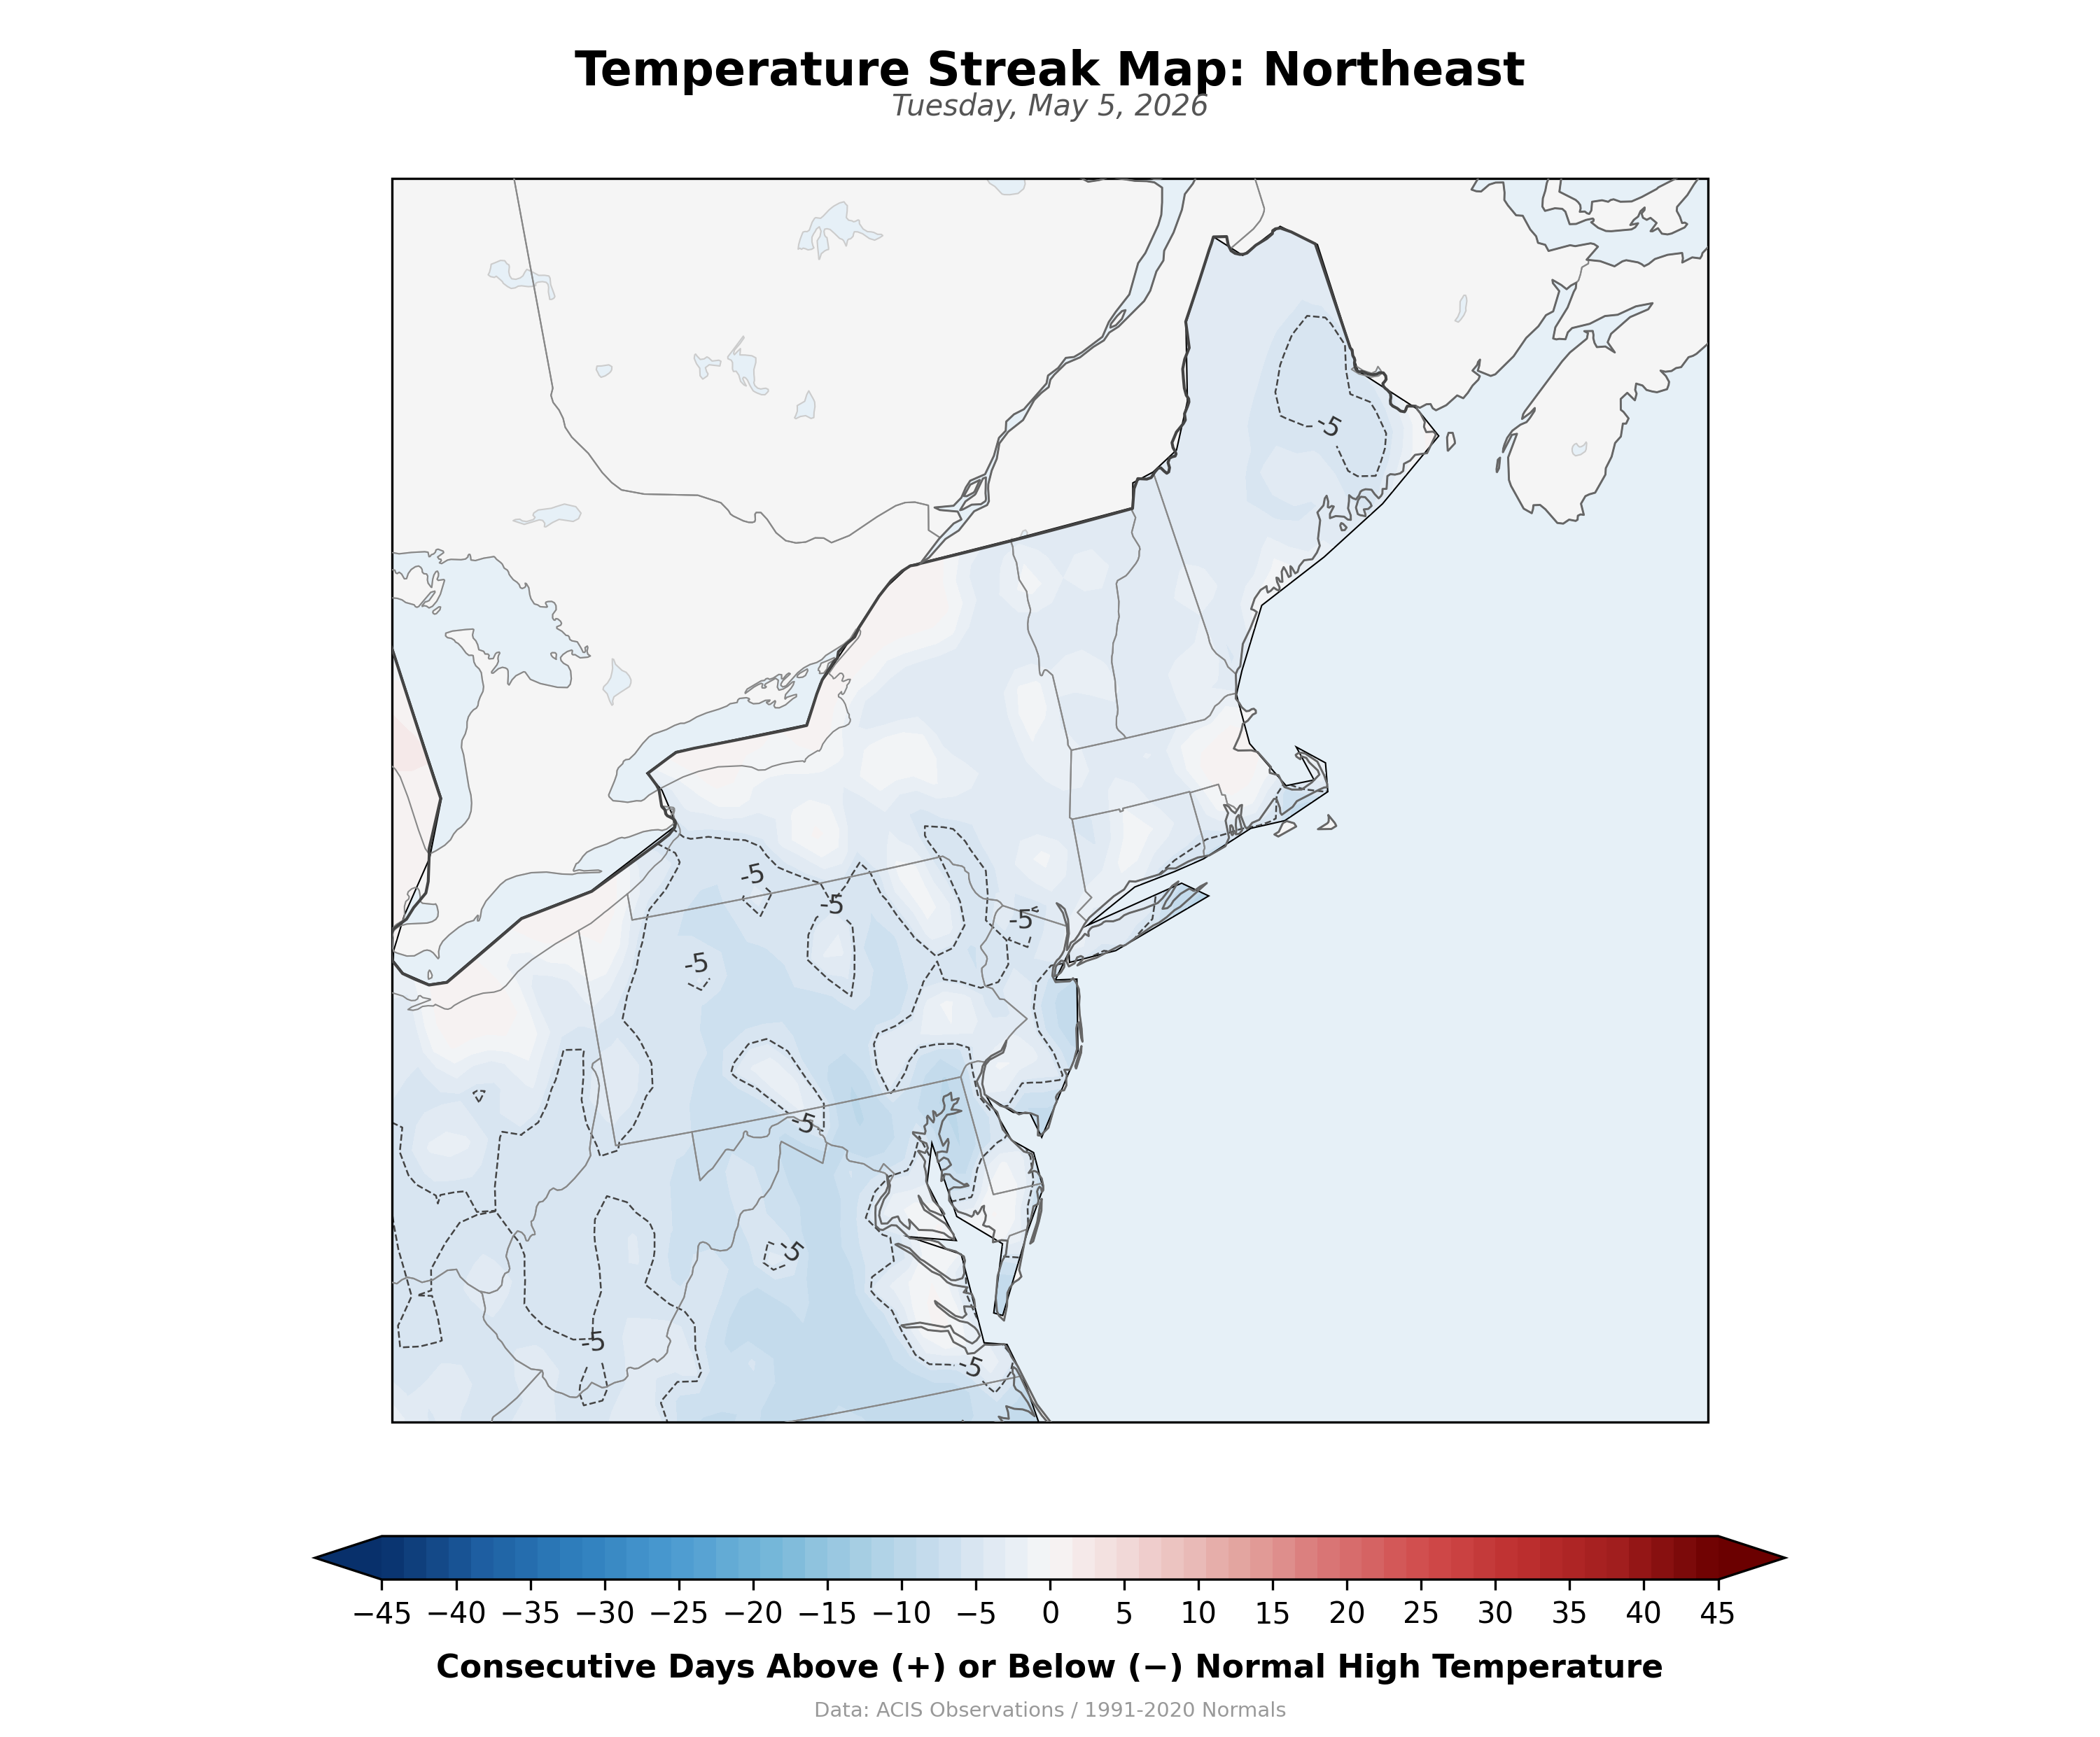
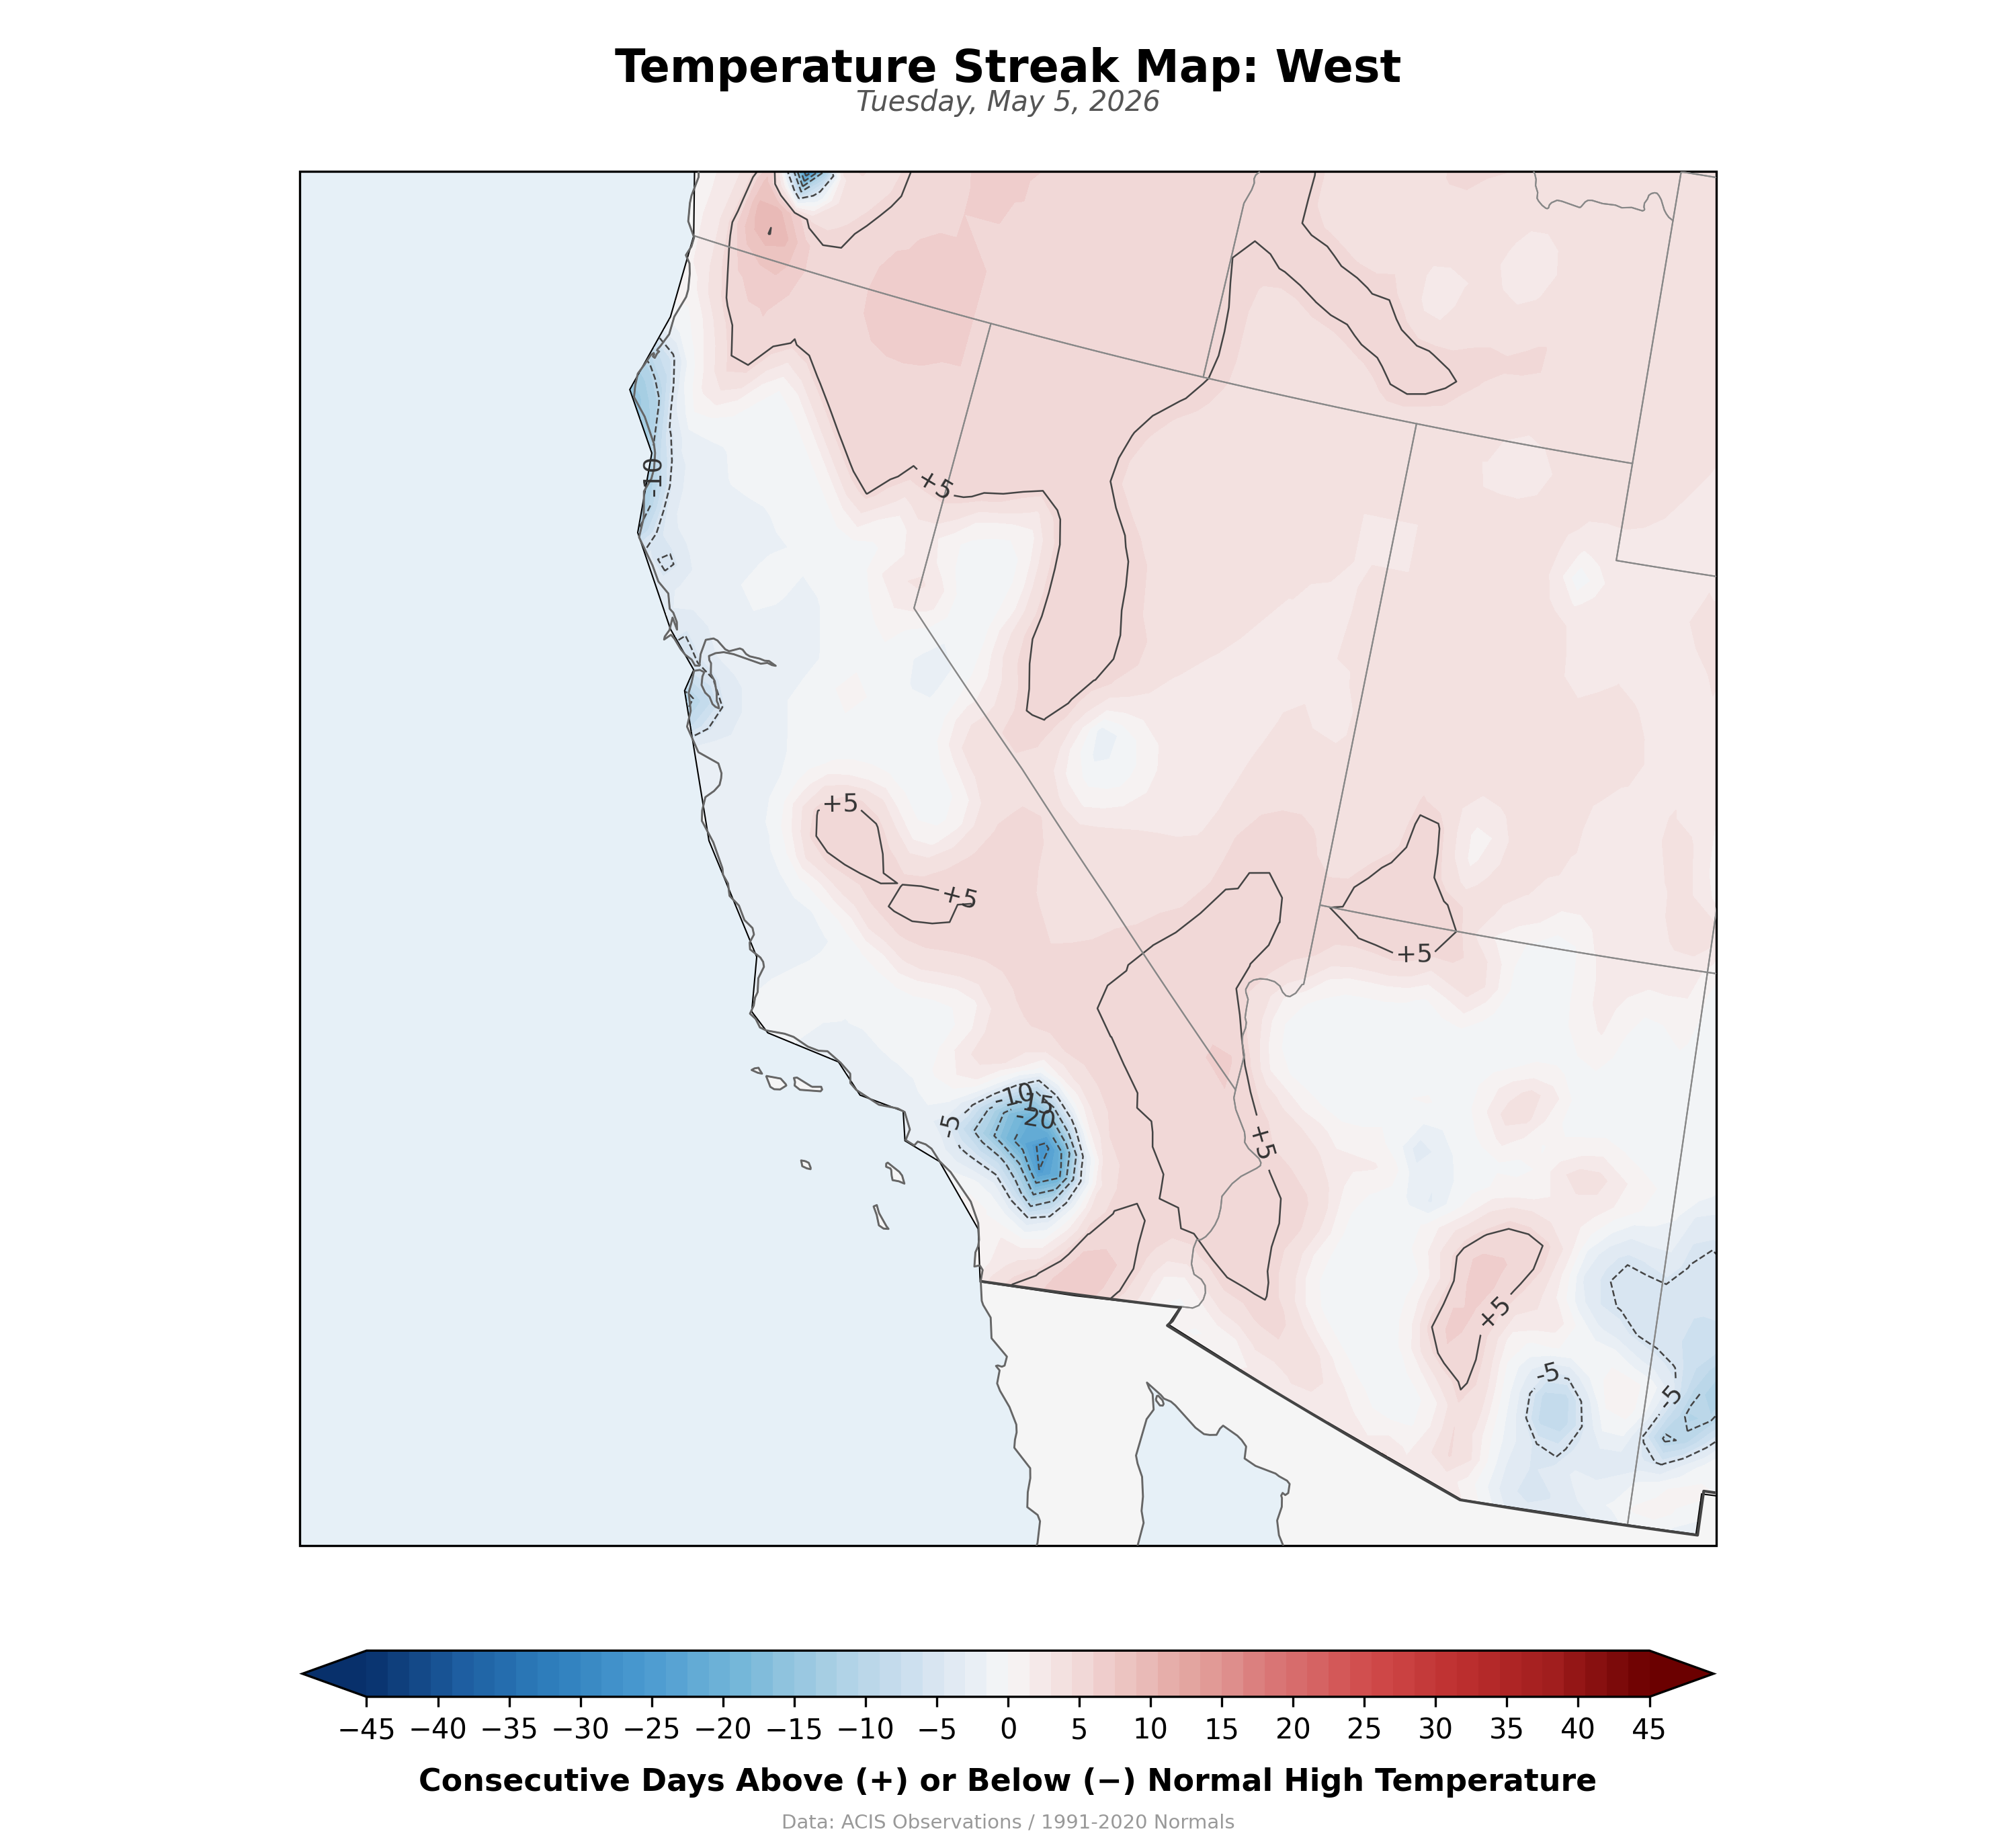
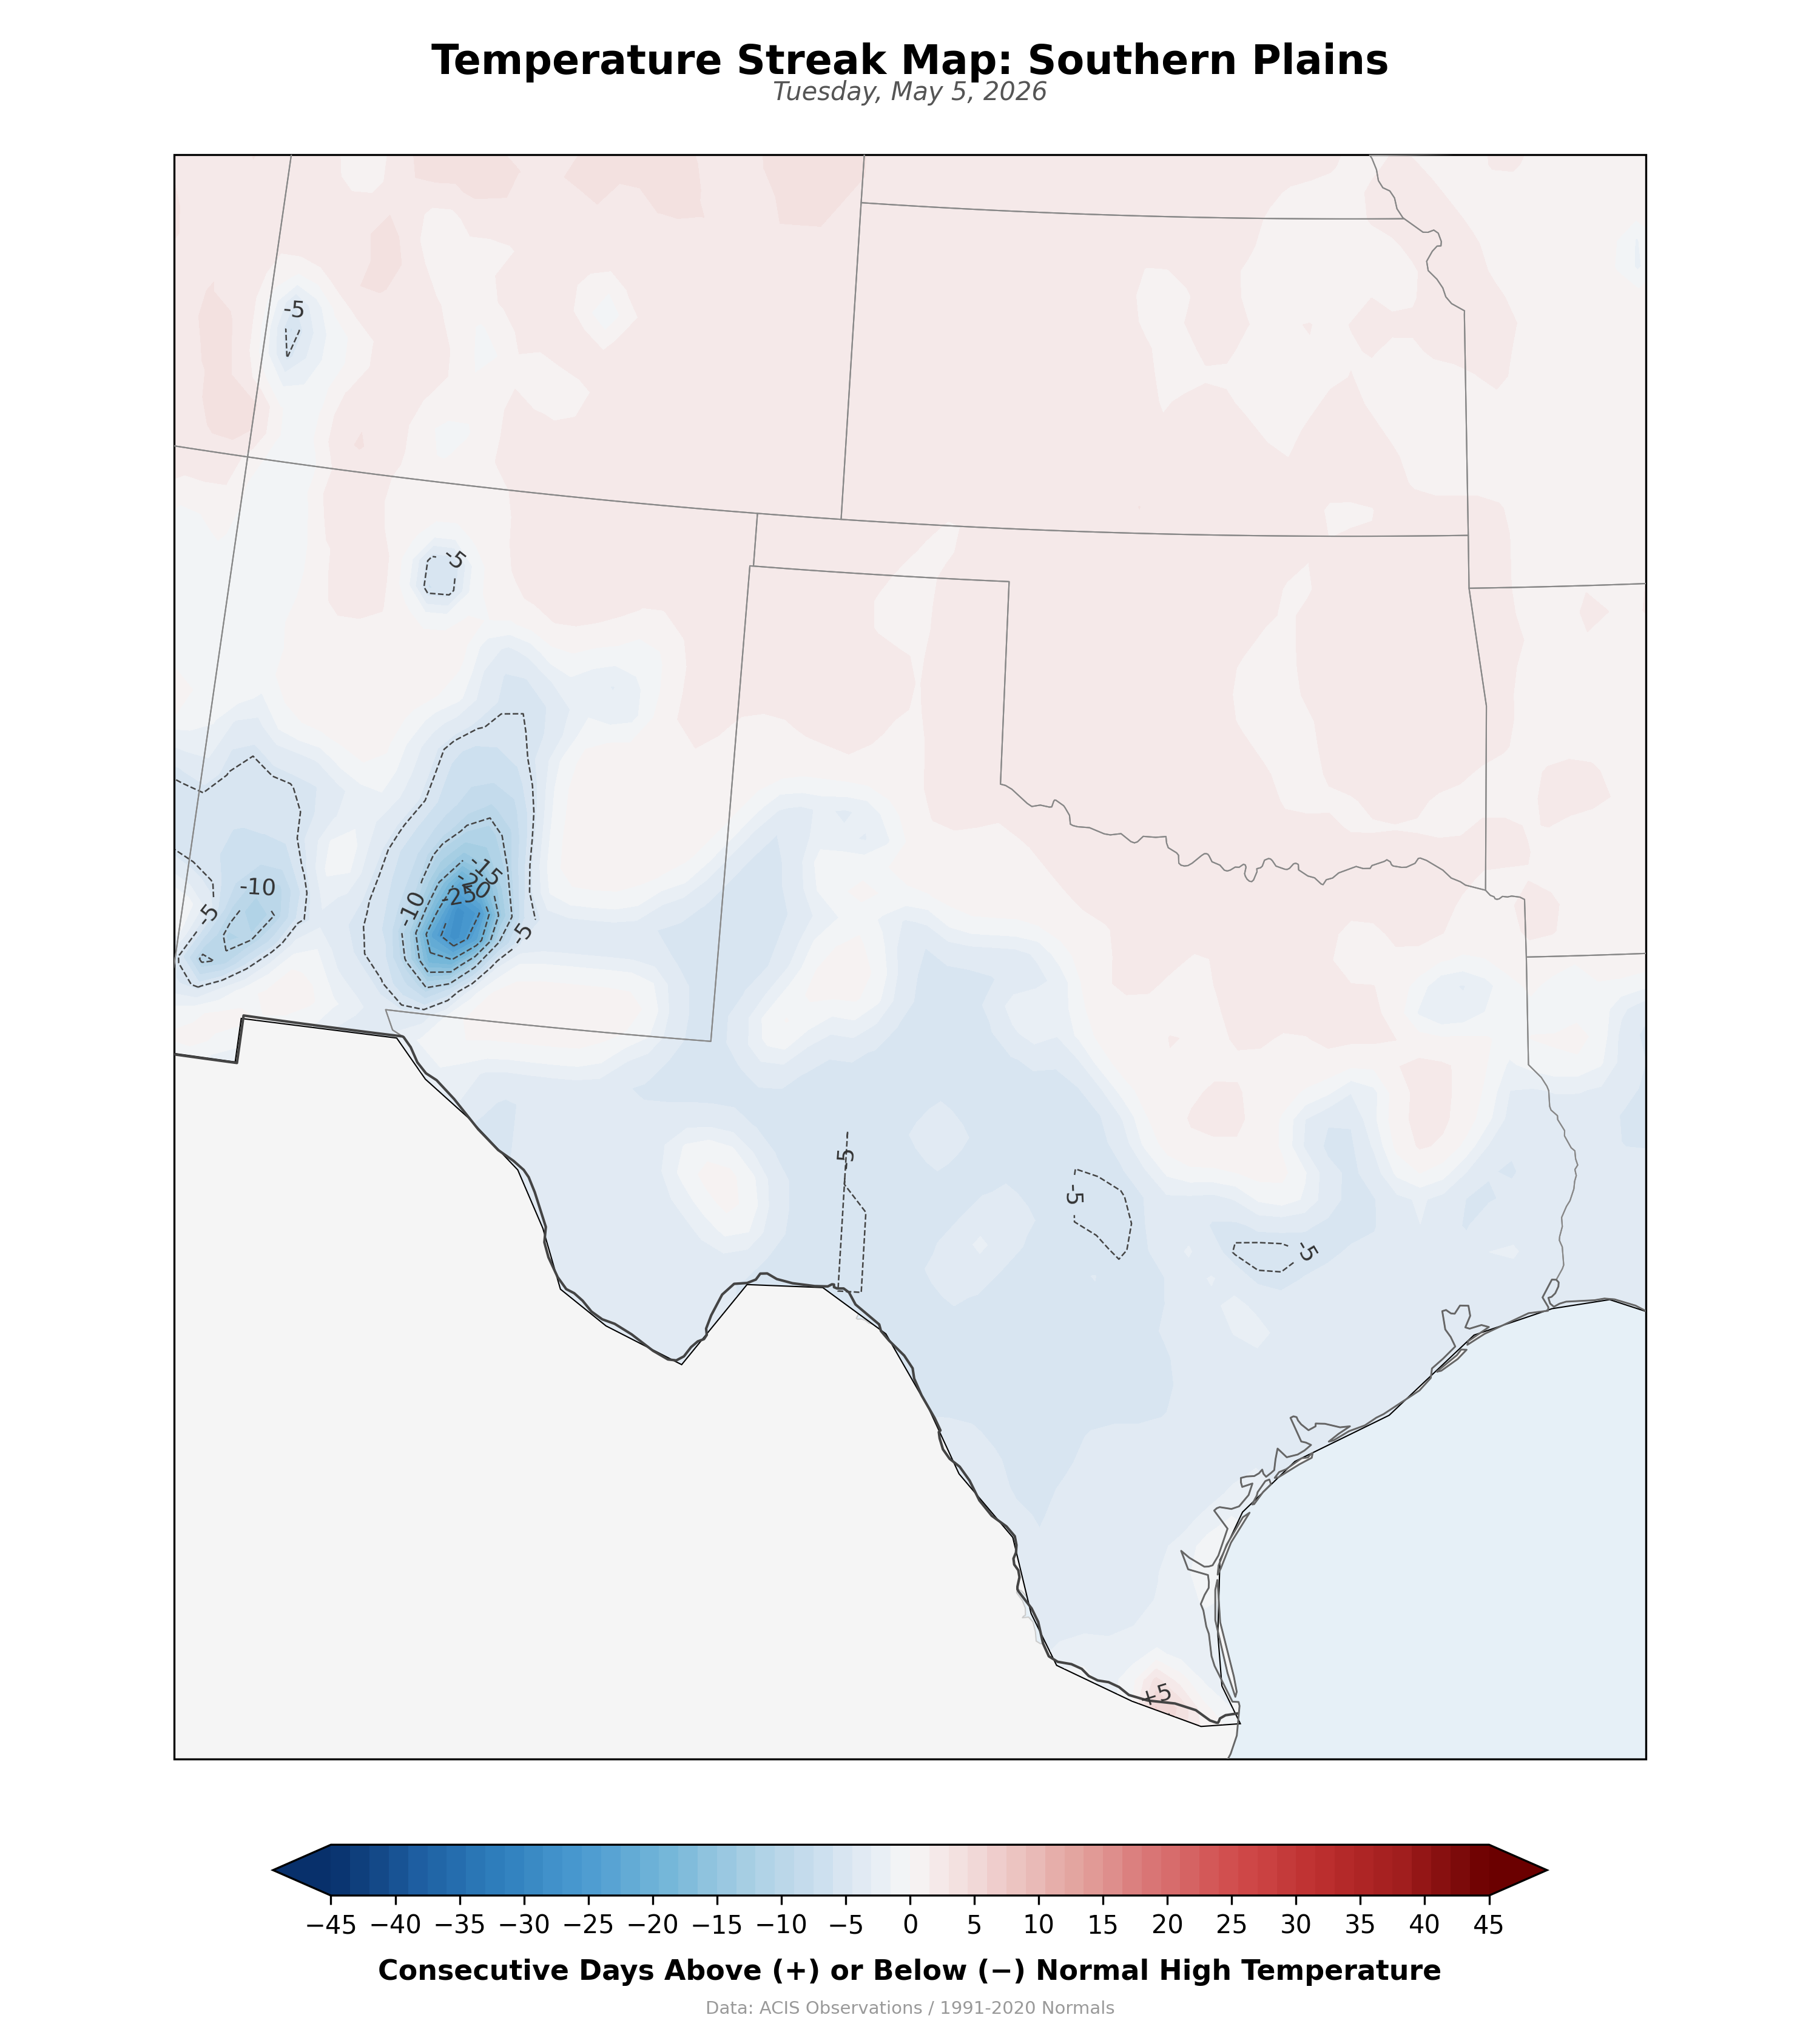
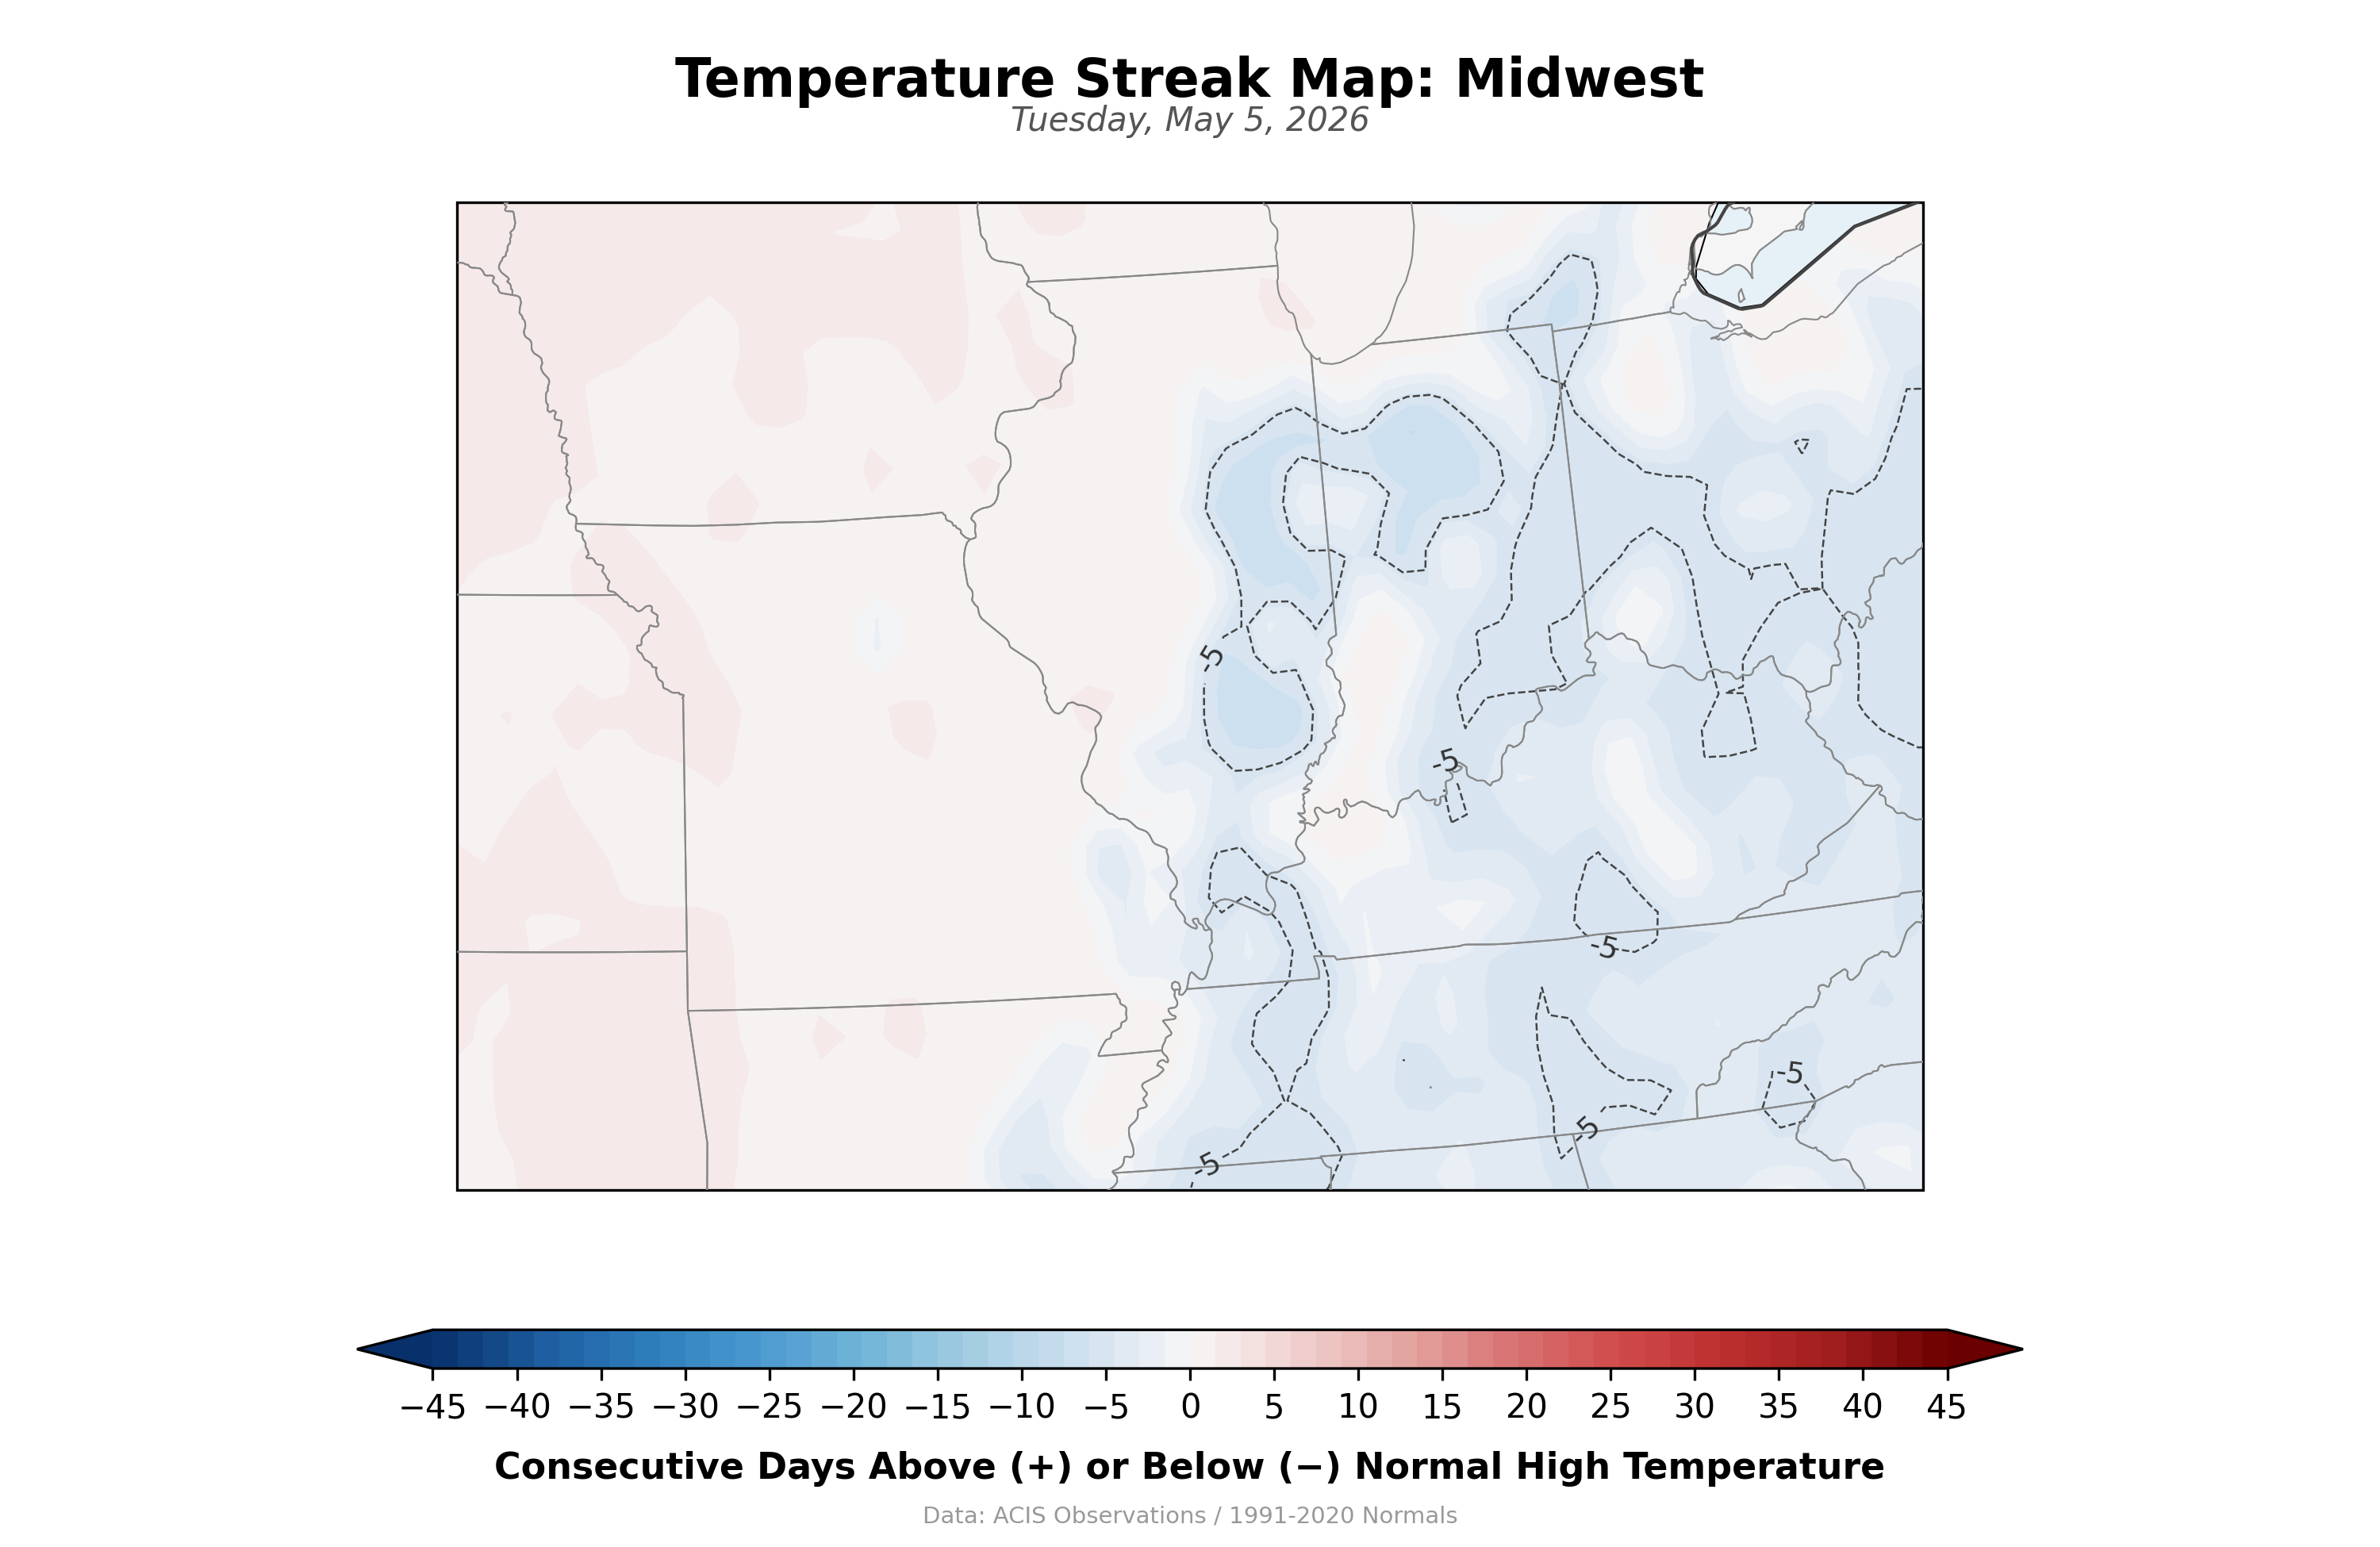
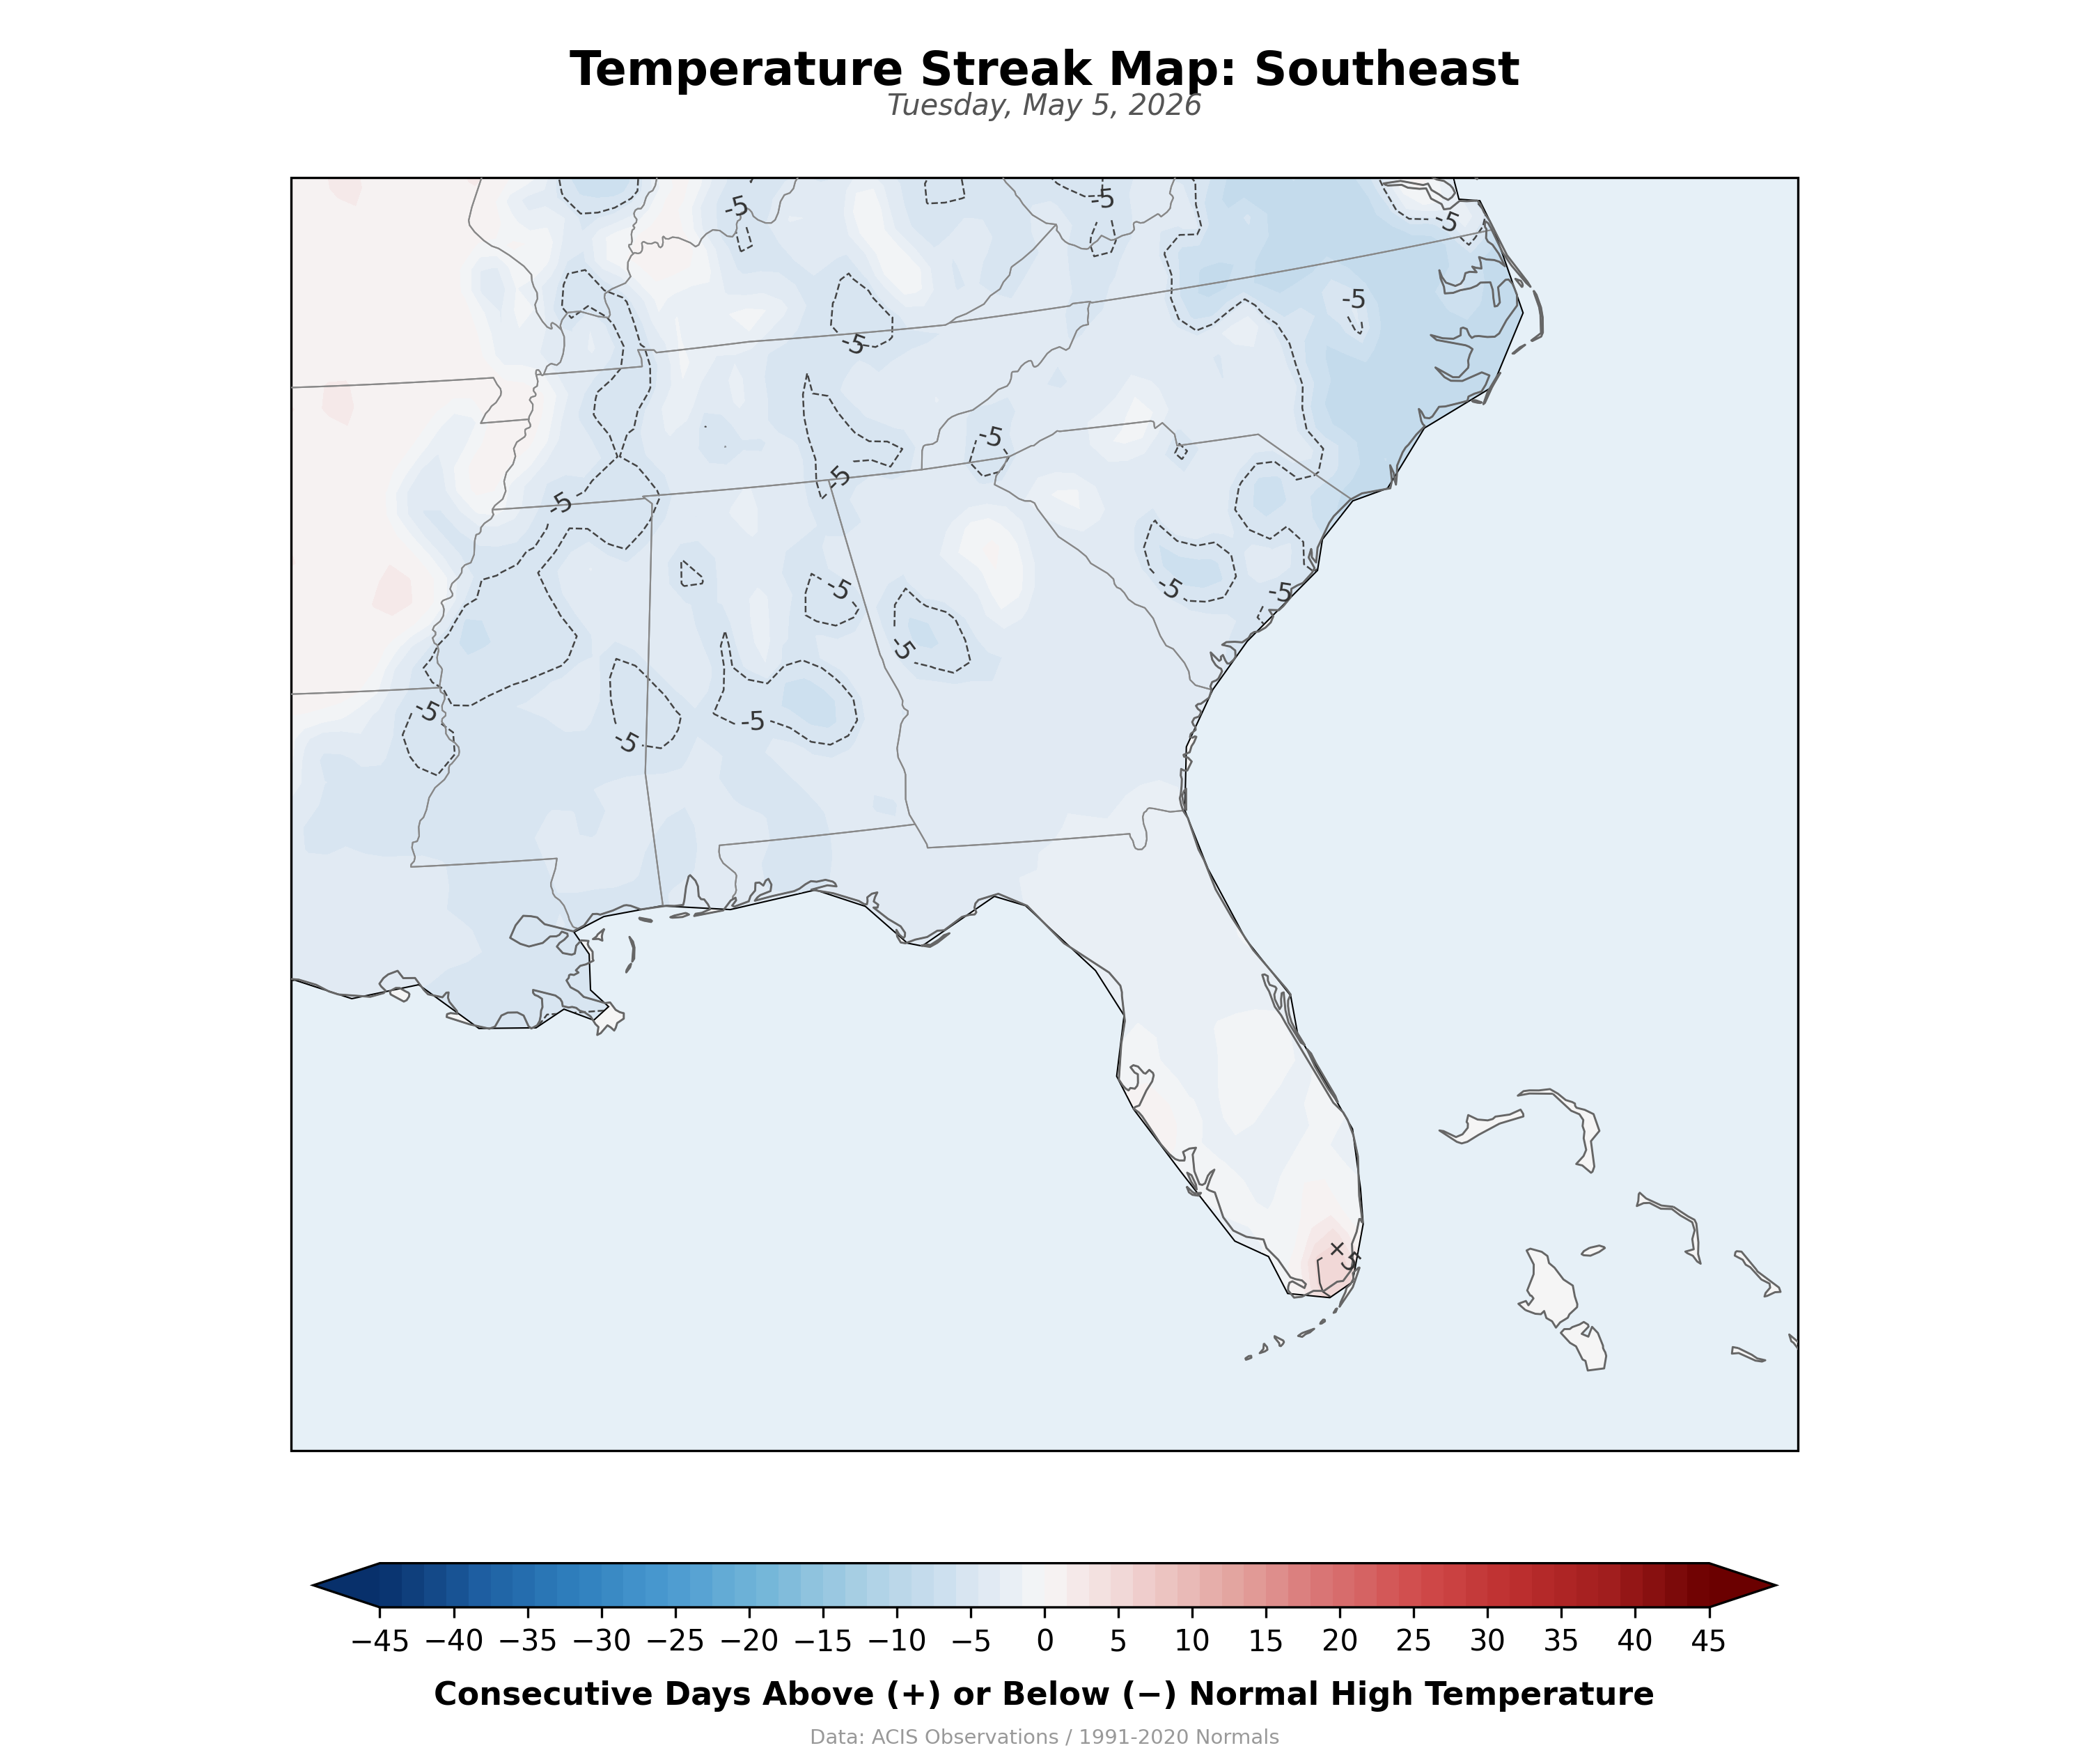
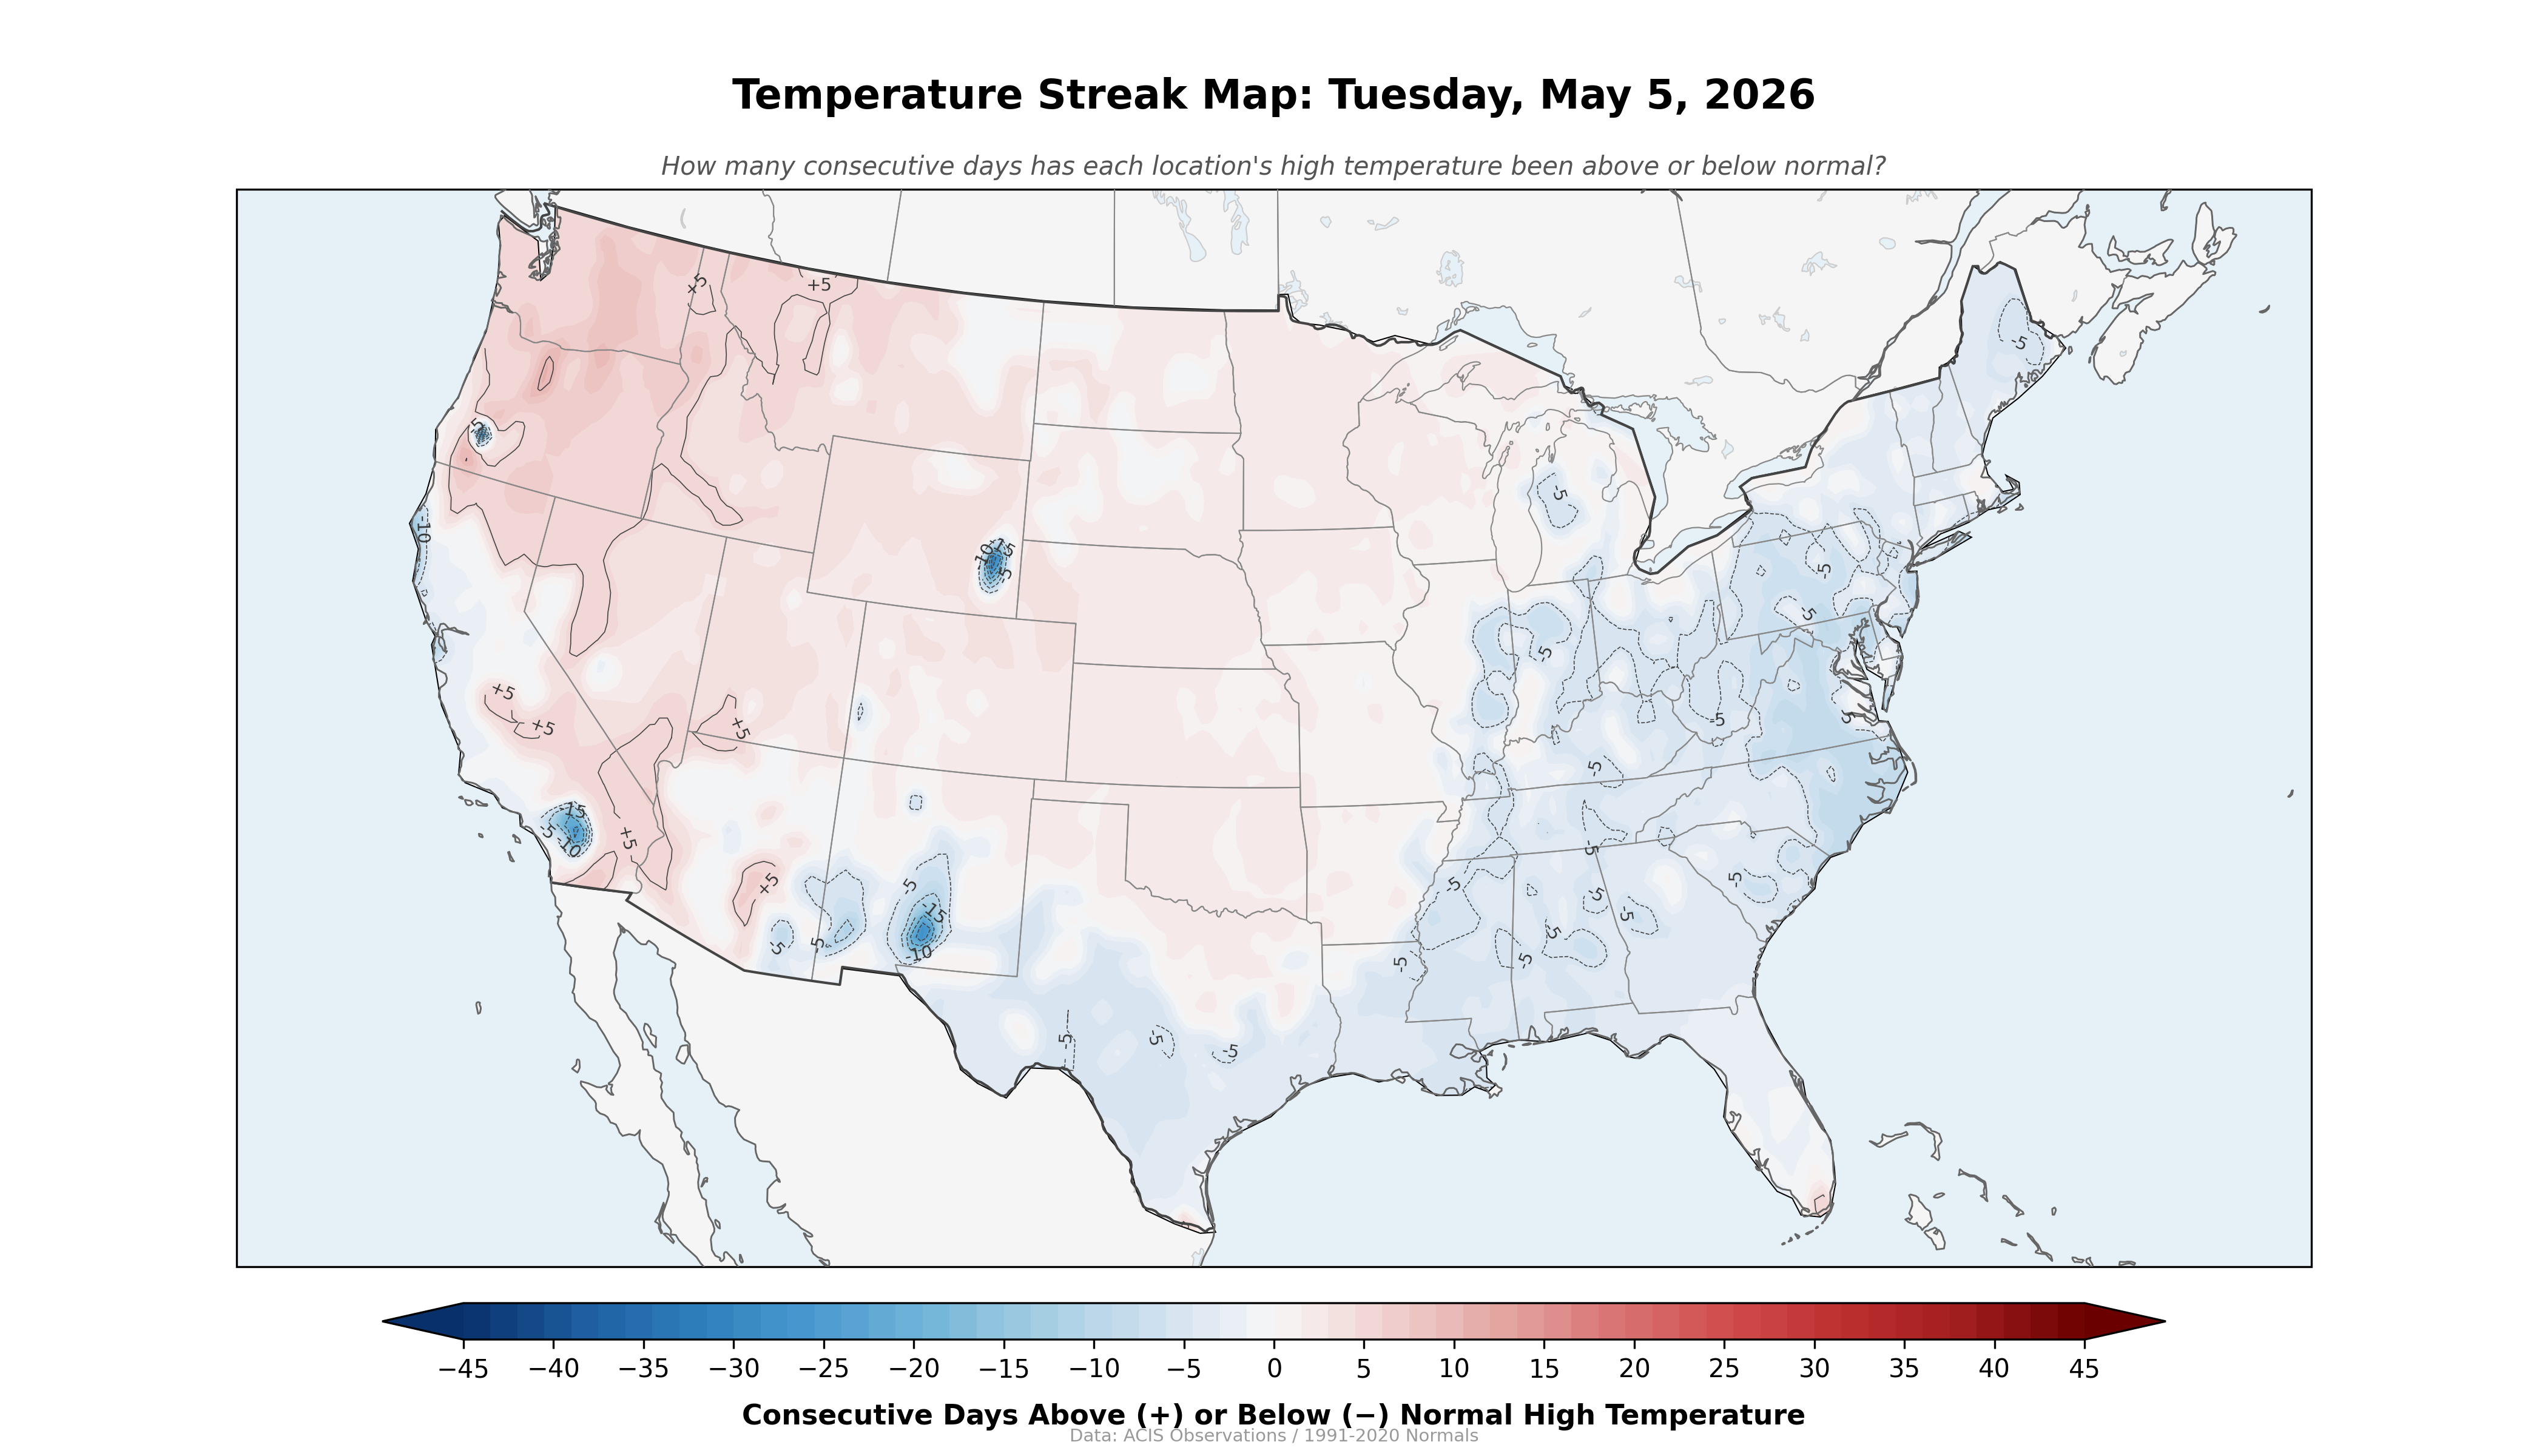
Temperature Streak Map
A daily-updating map that shows how many consecutive days each location's high temperature has been above or below normal. Not the magnitude of the anomaly — the persistence. "This is day 18 in a row of above-normal highs" tells you something fundamentally different from "today is 5°F above normal."
Click the map for full resolution (300 DPI).
This is an independent project and is not an official product of the National Weather Service or NOAA. Data: ACIS observed high temperatures / 1991–2020 daily normals.
Regional Views
Click any region for a full-resolution crop.