Alex Cooke
Research
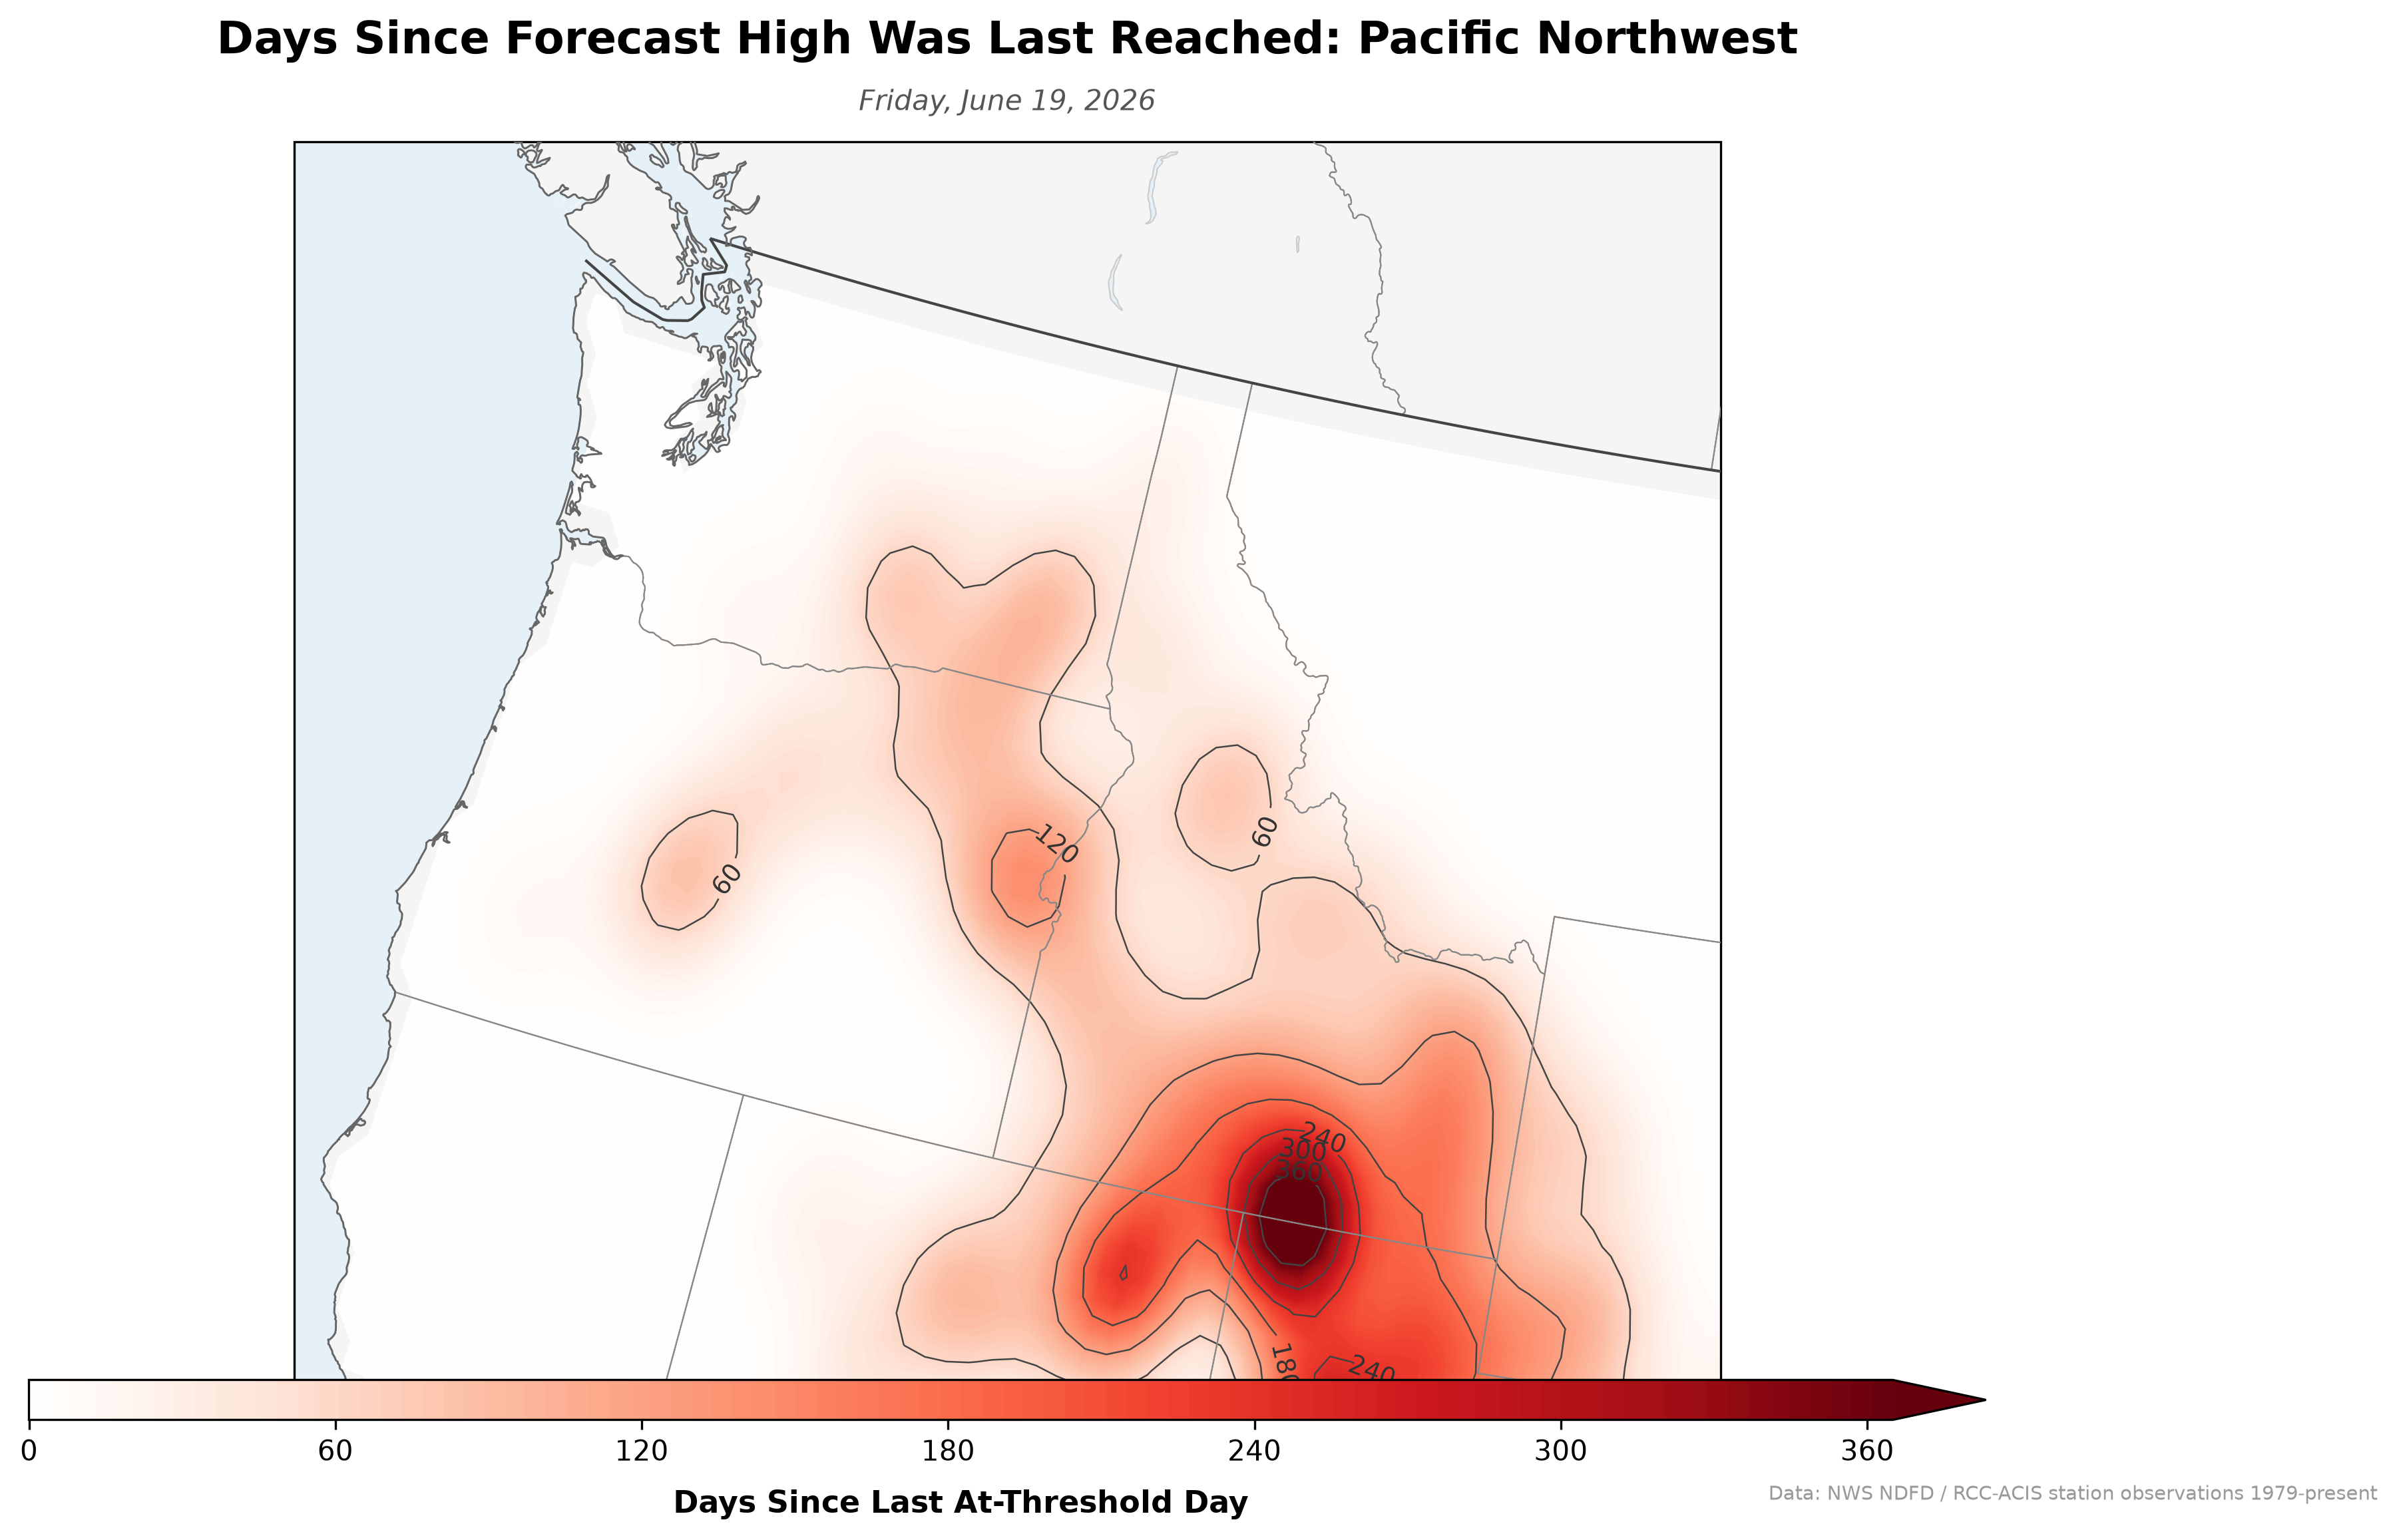
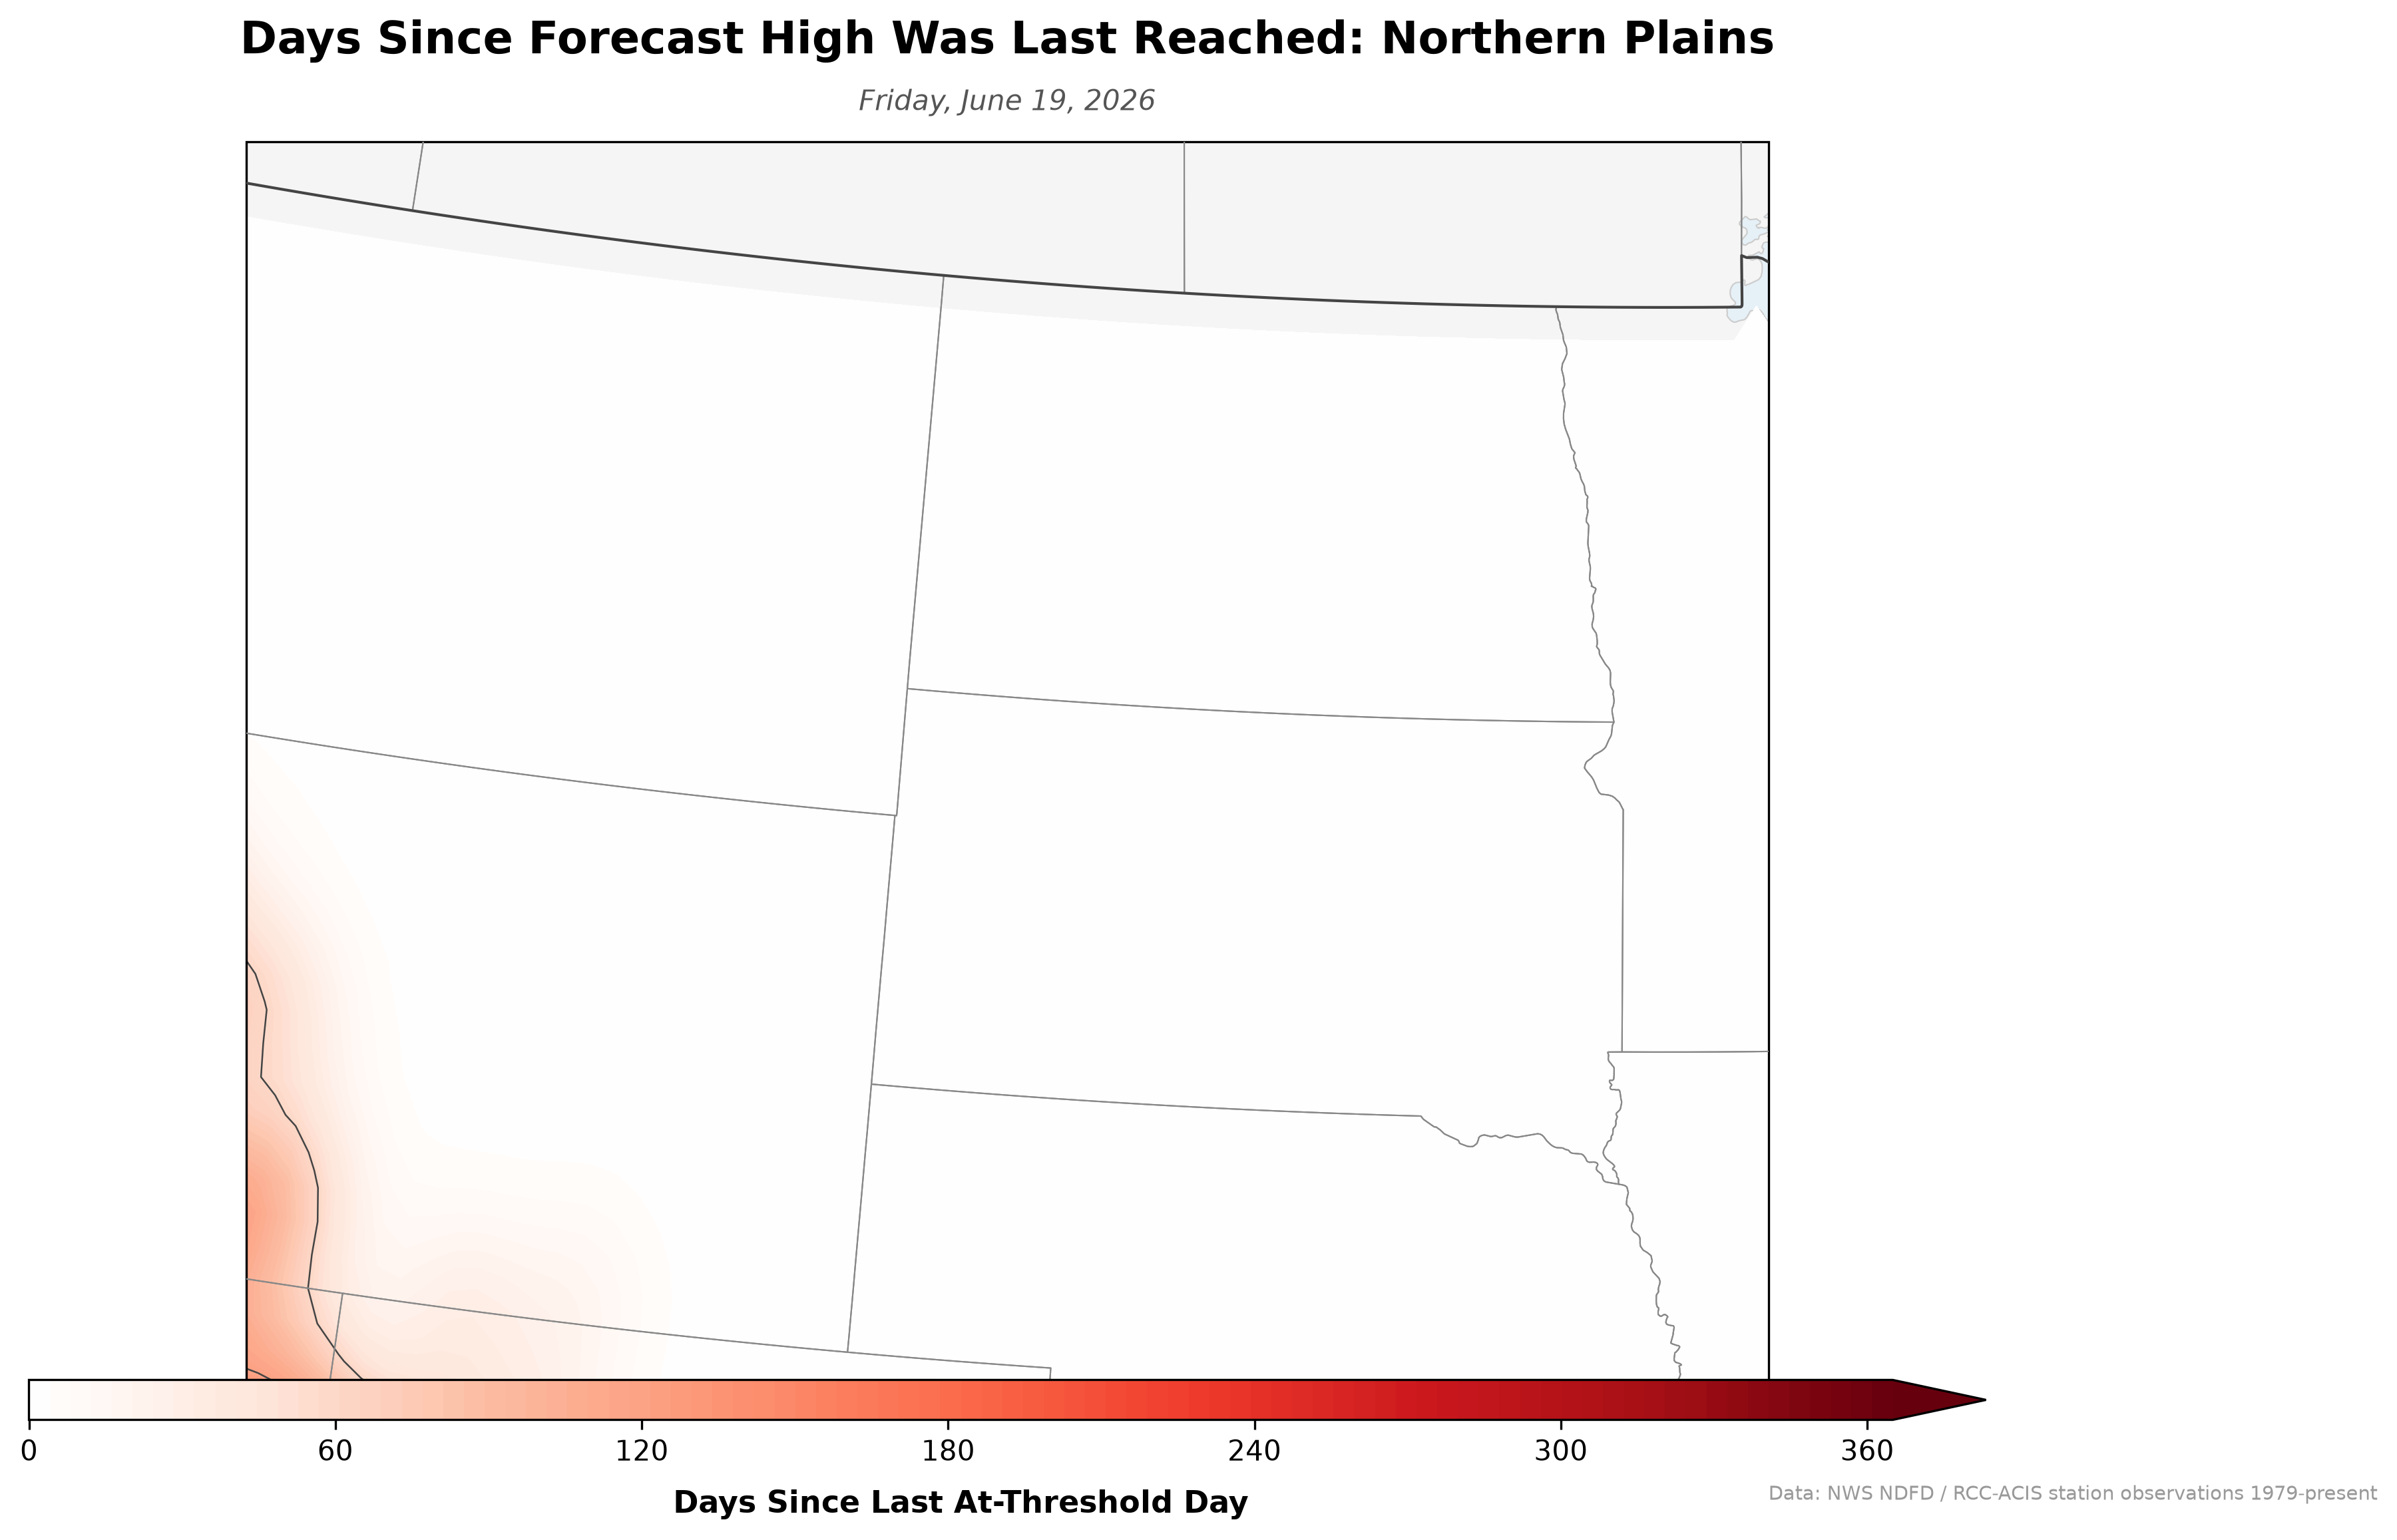
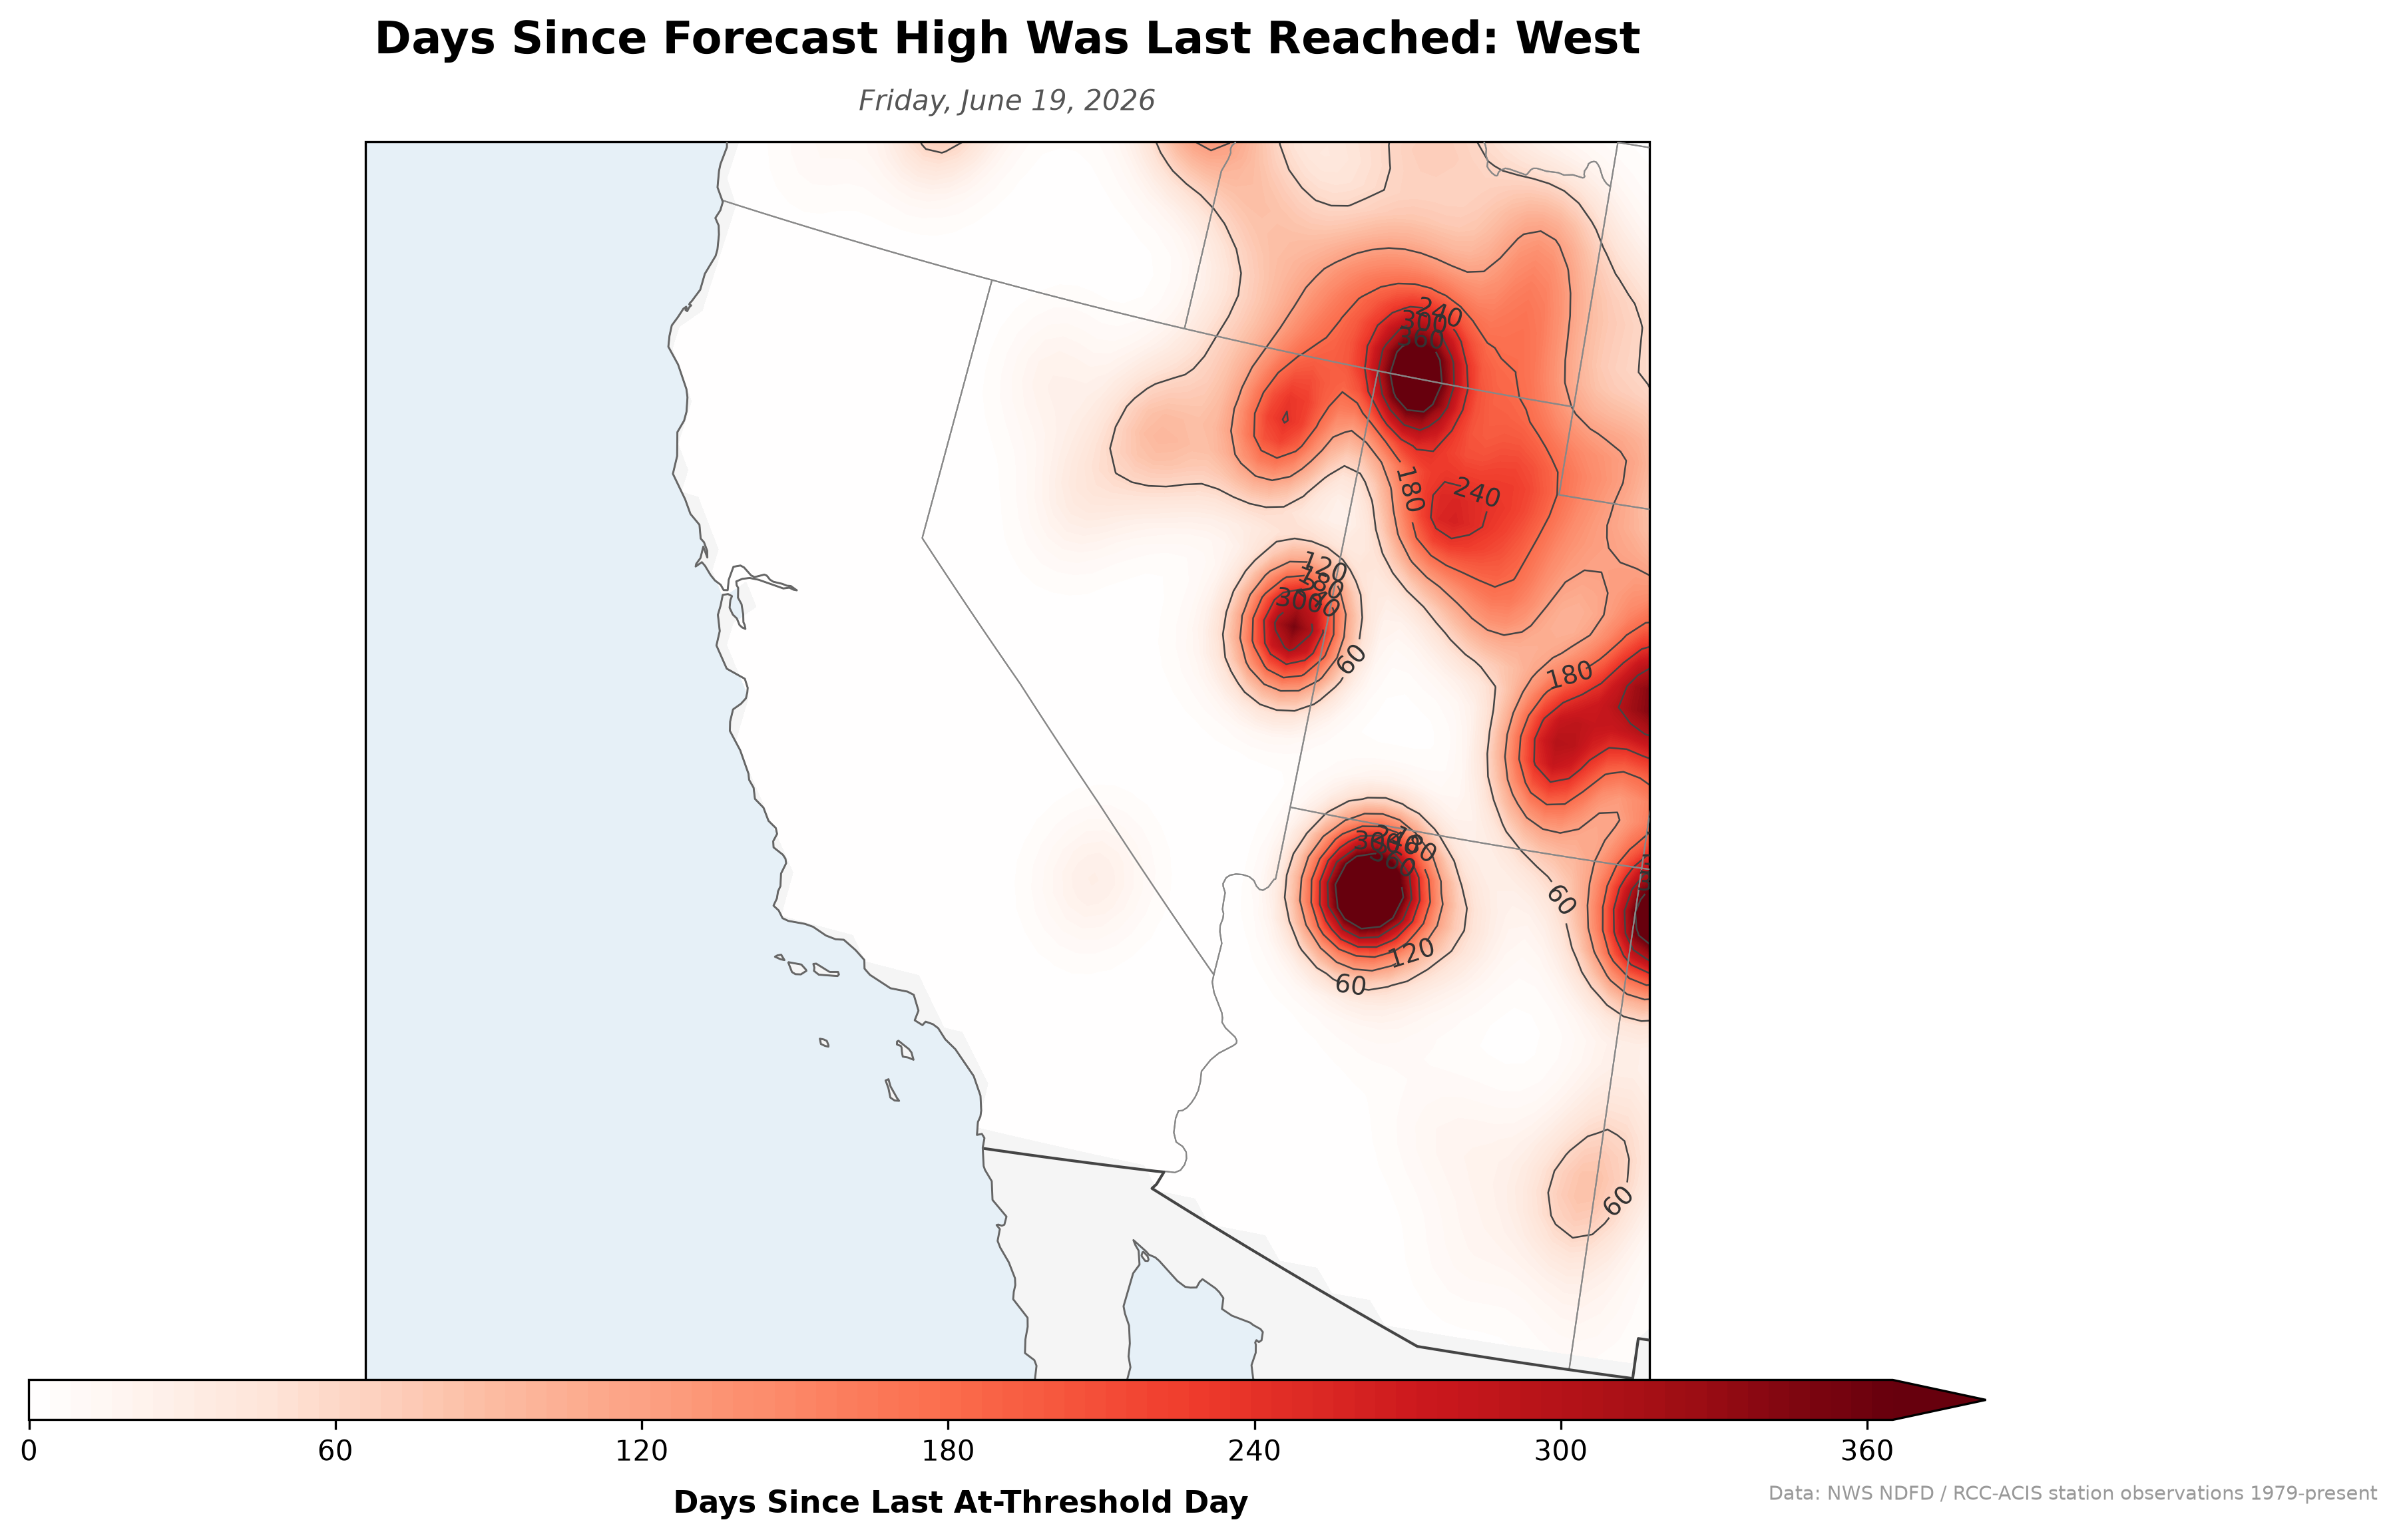
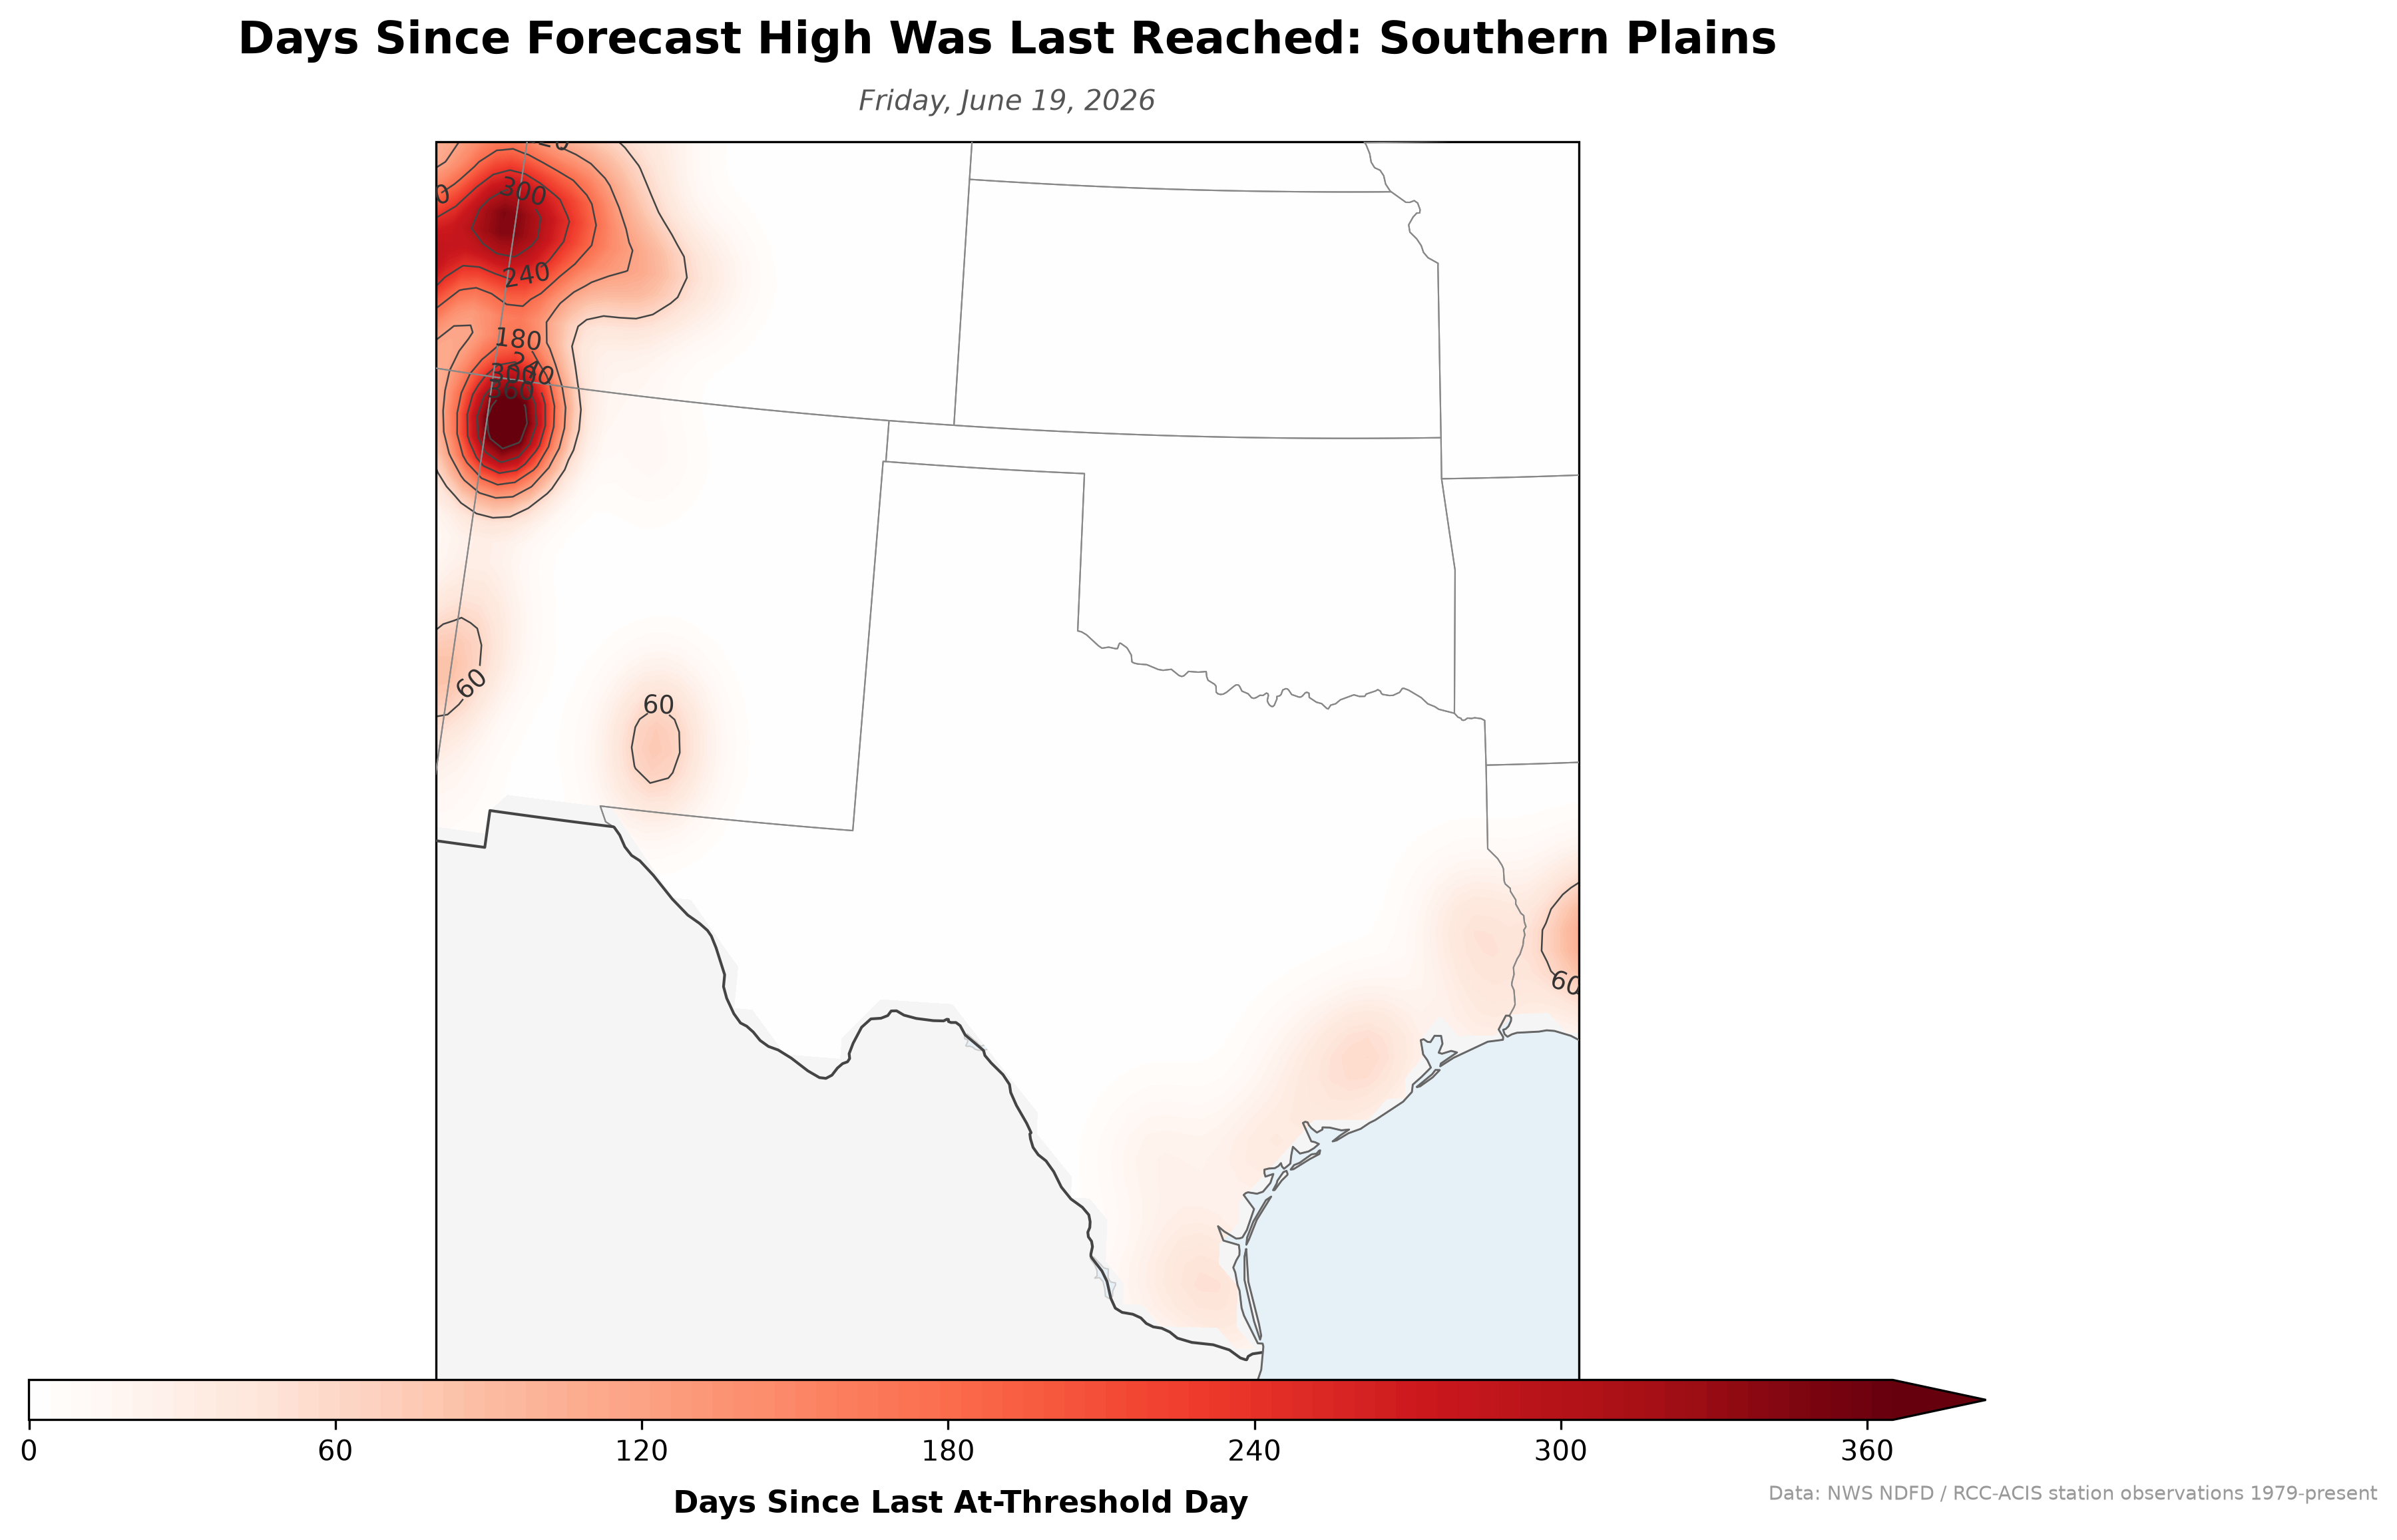
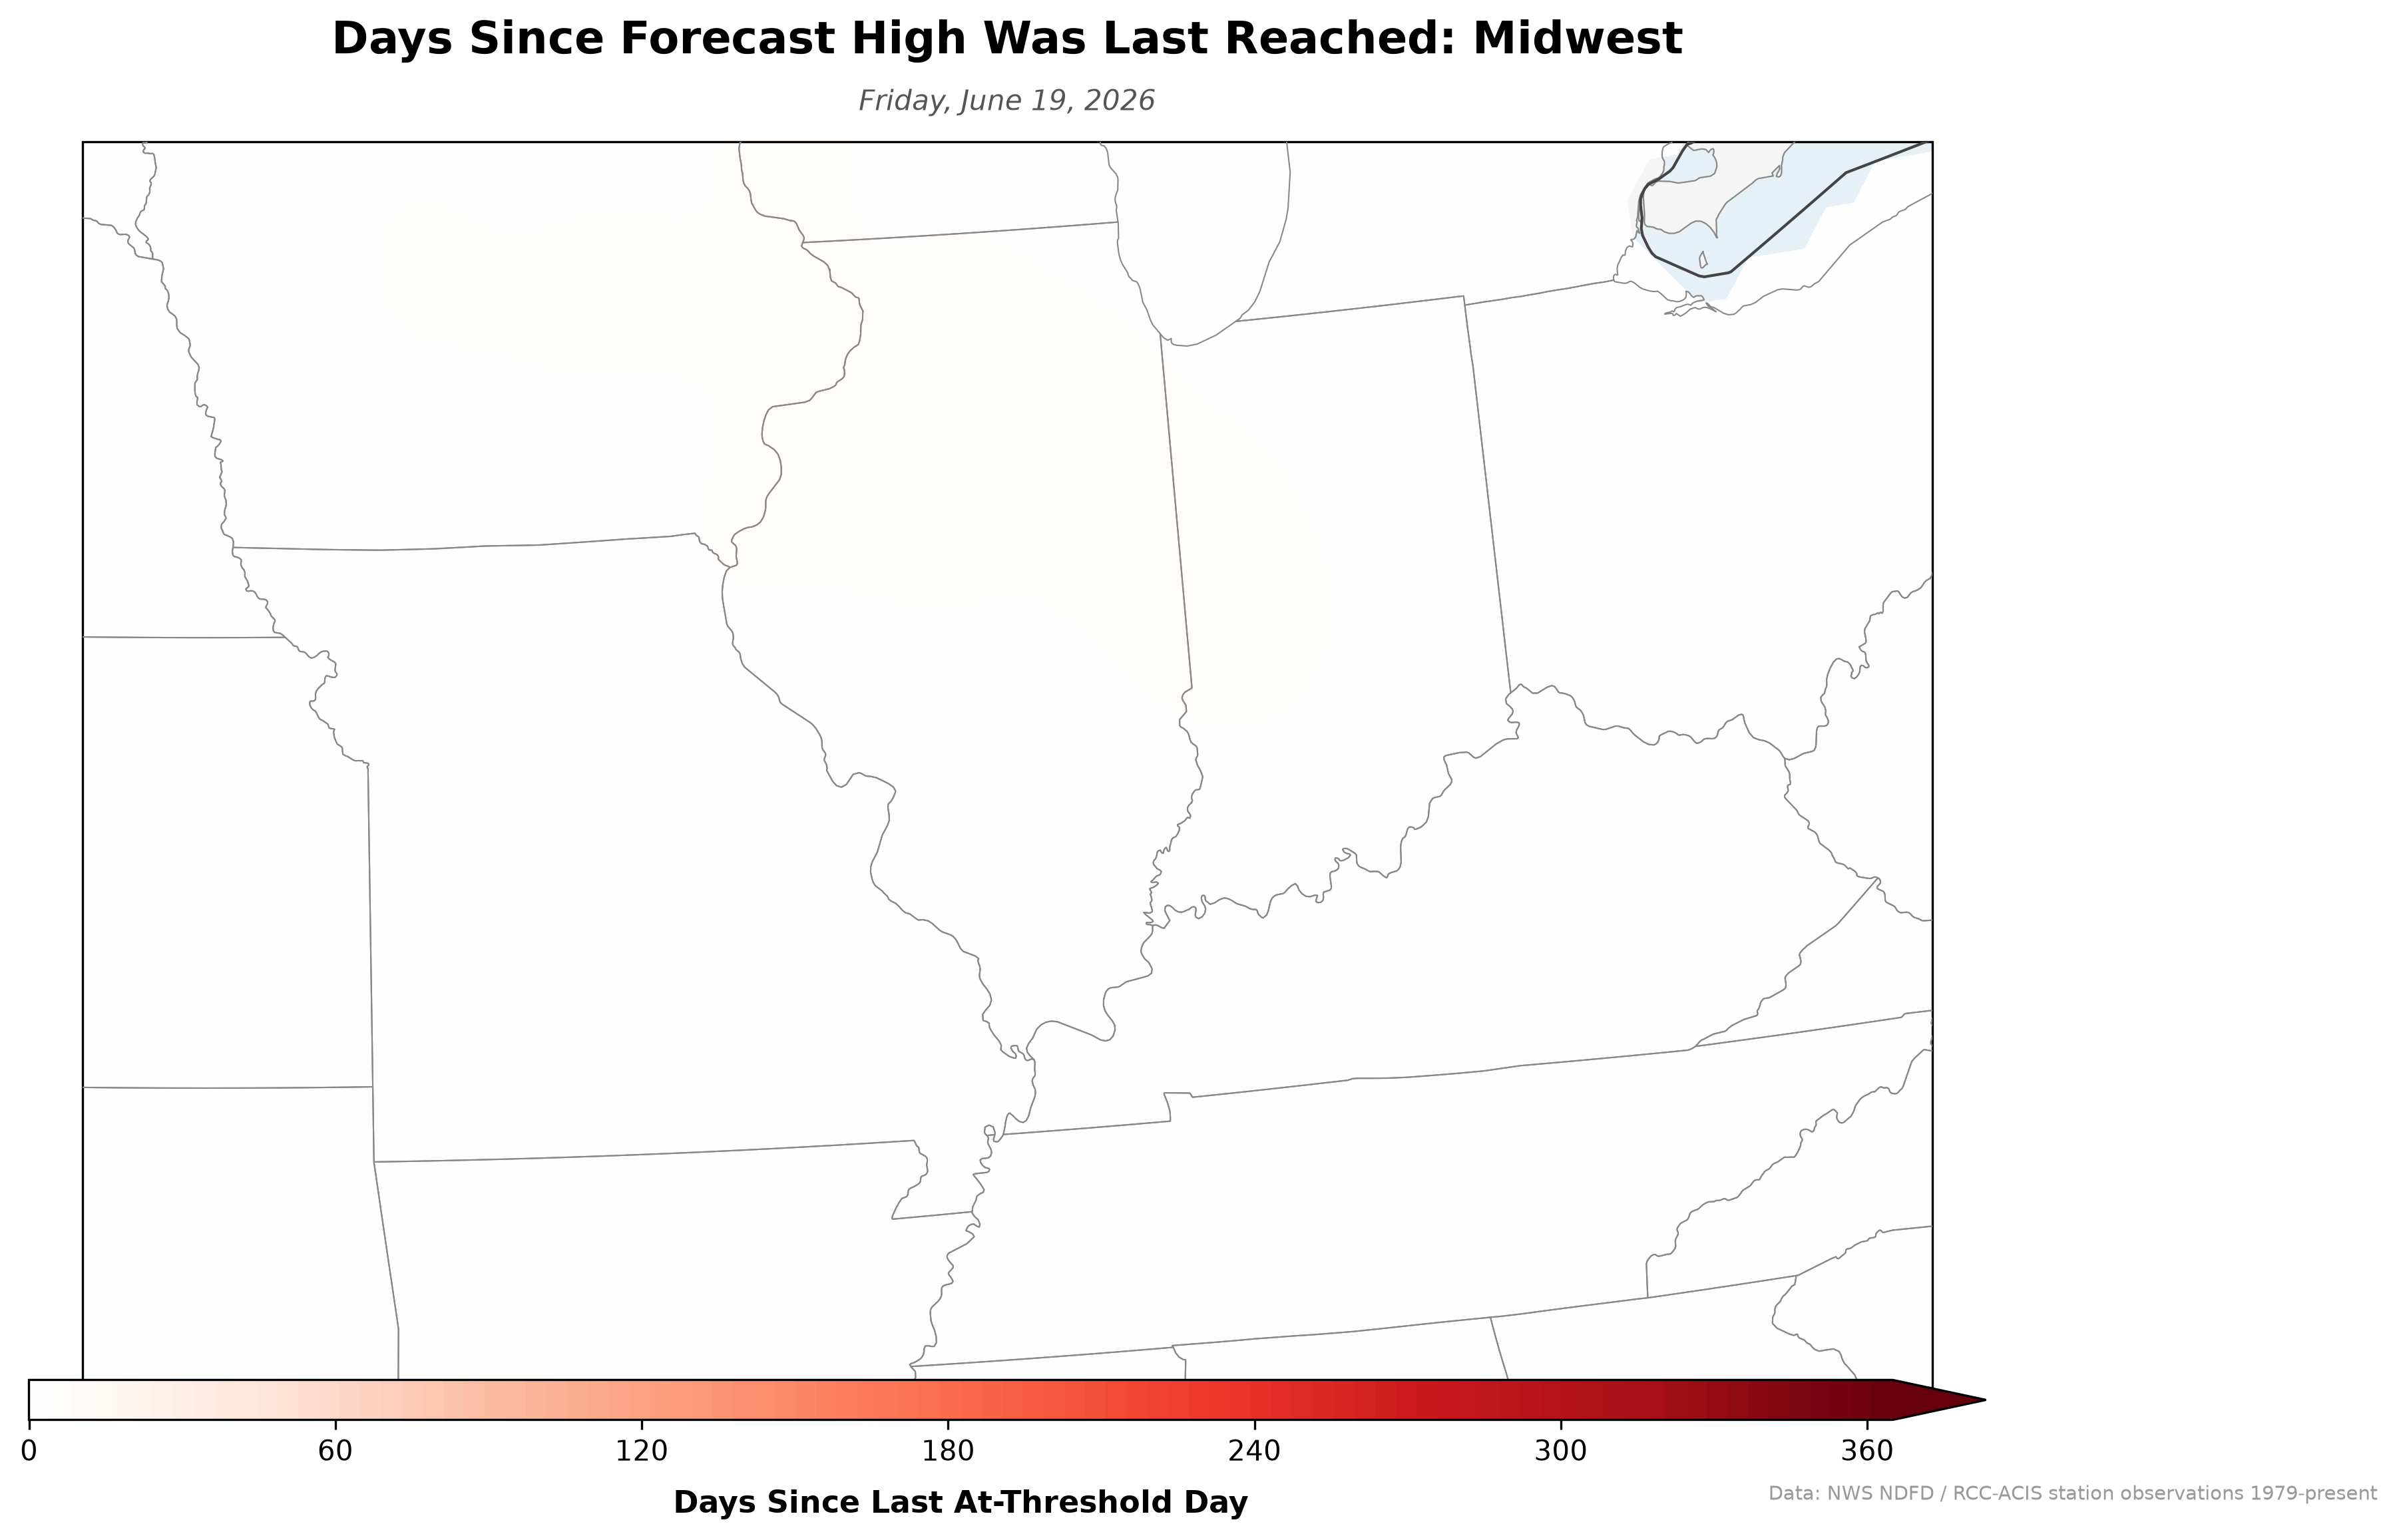
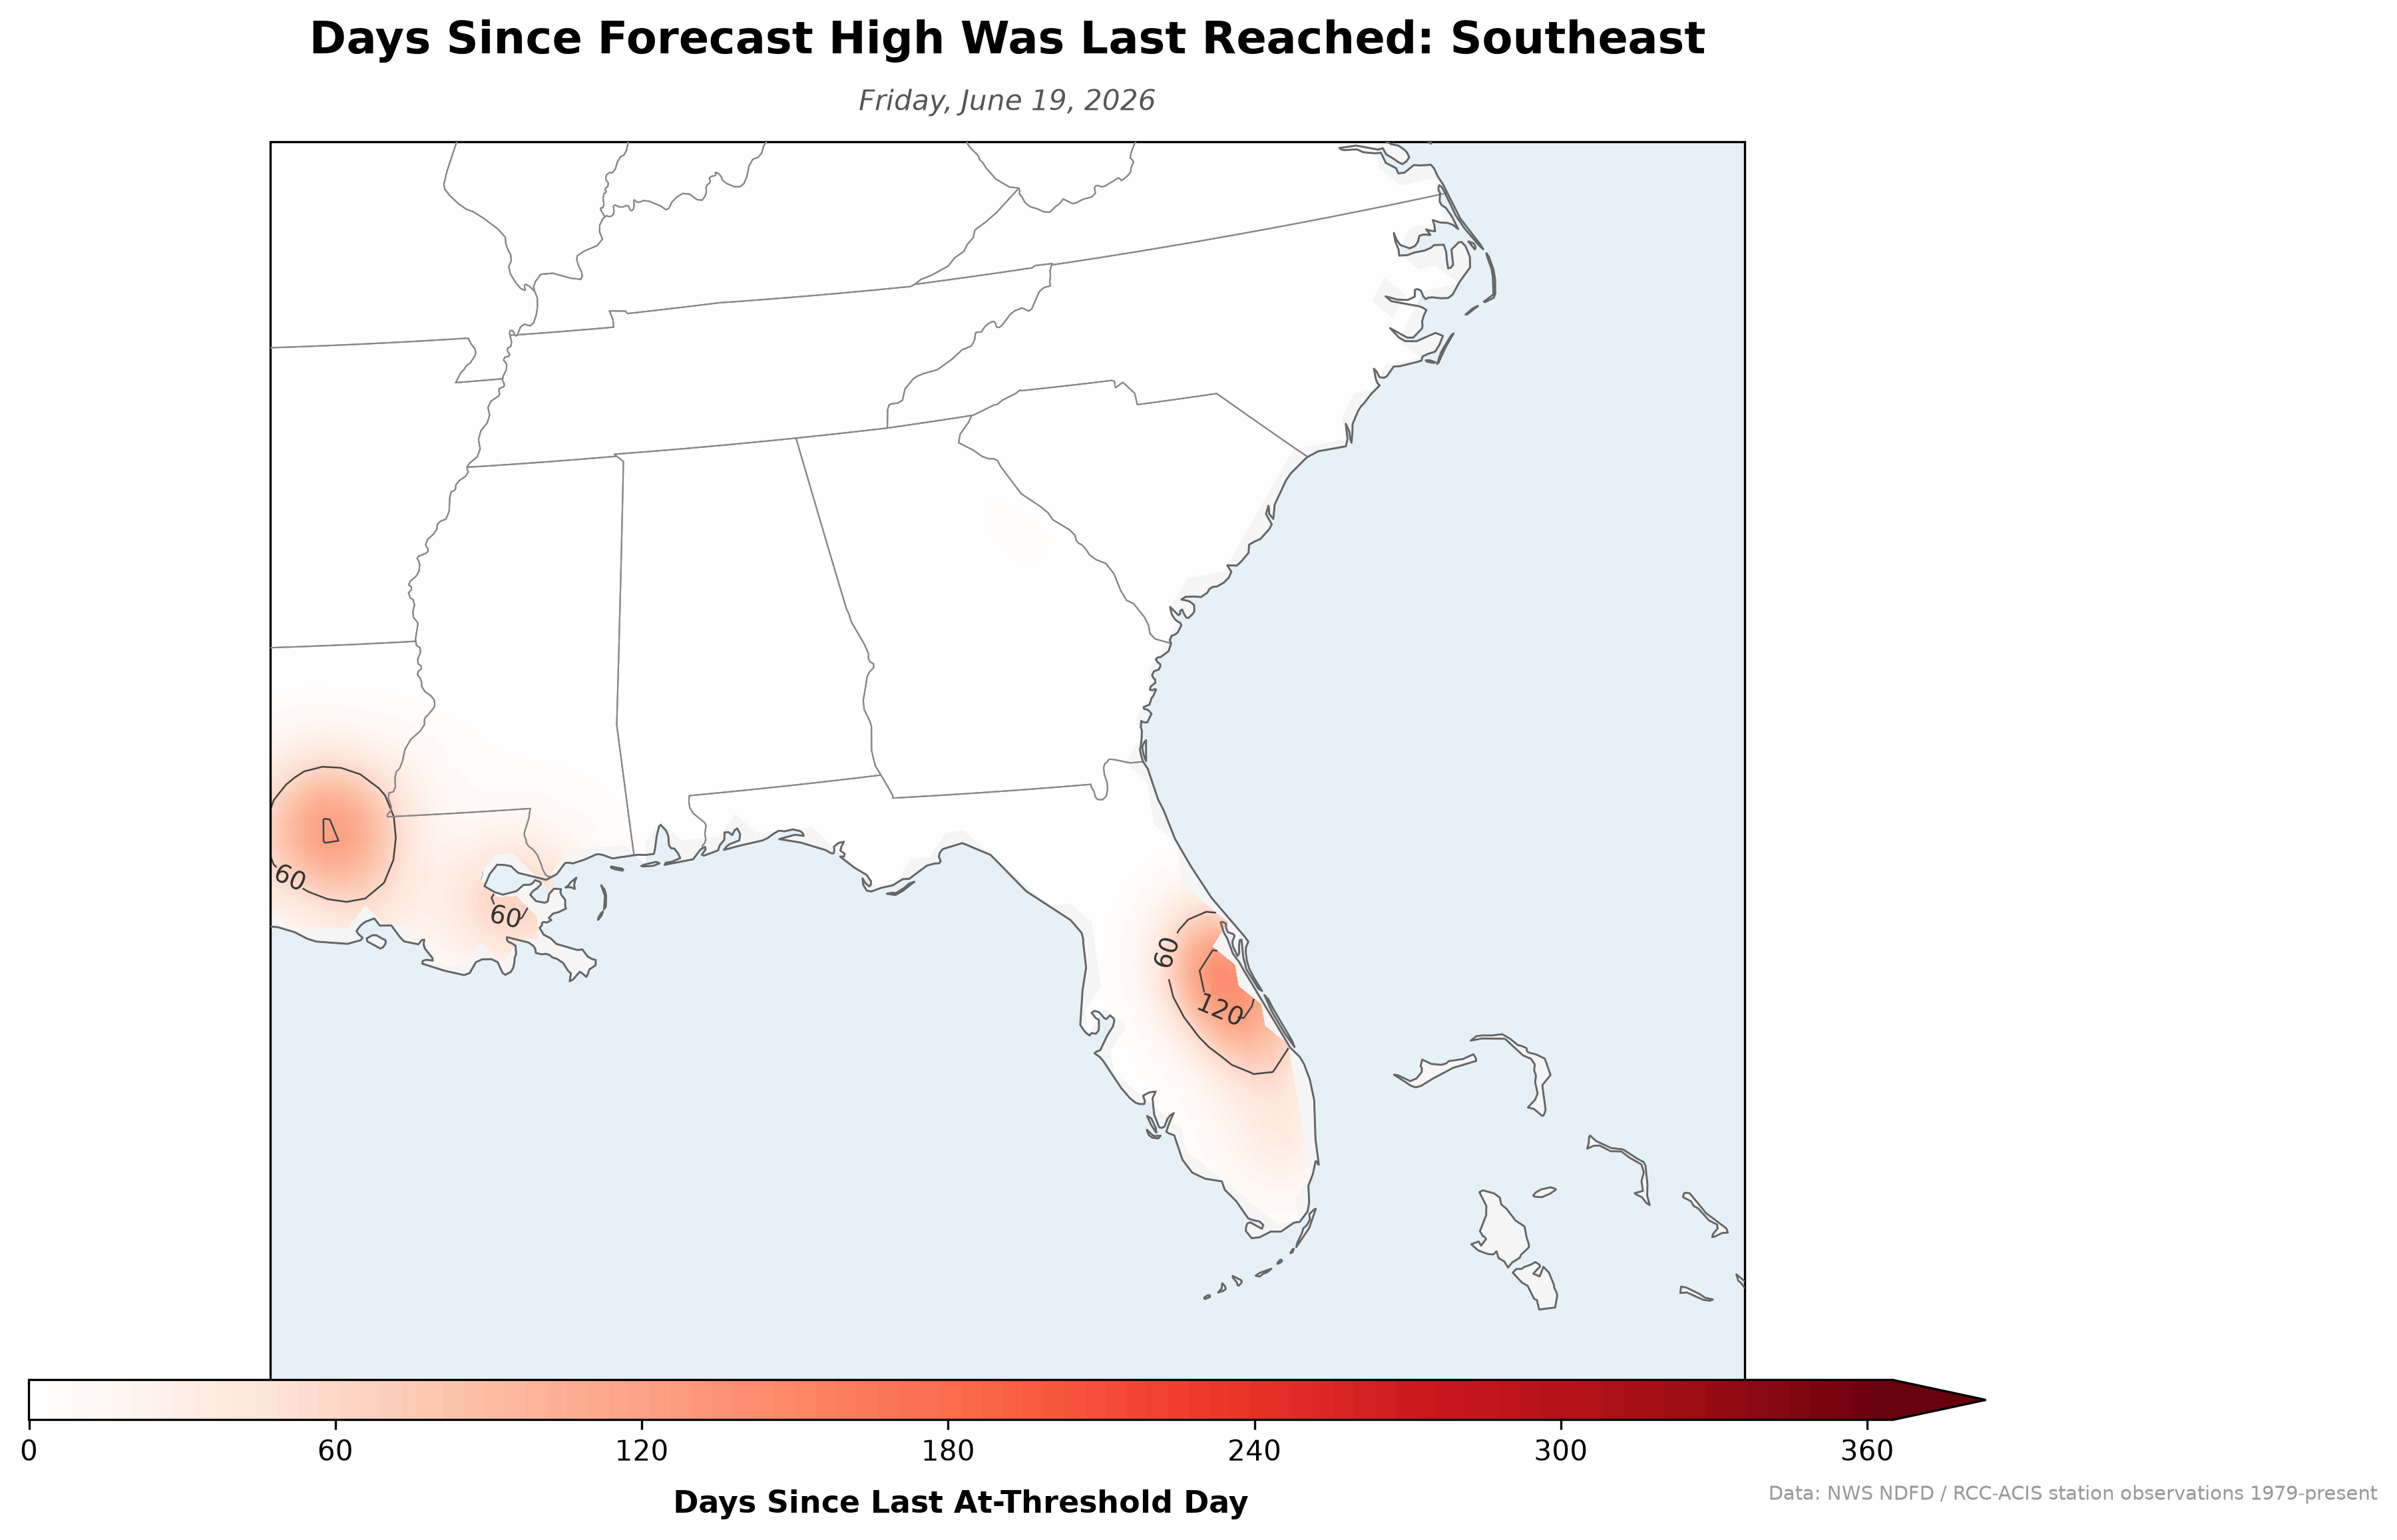
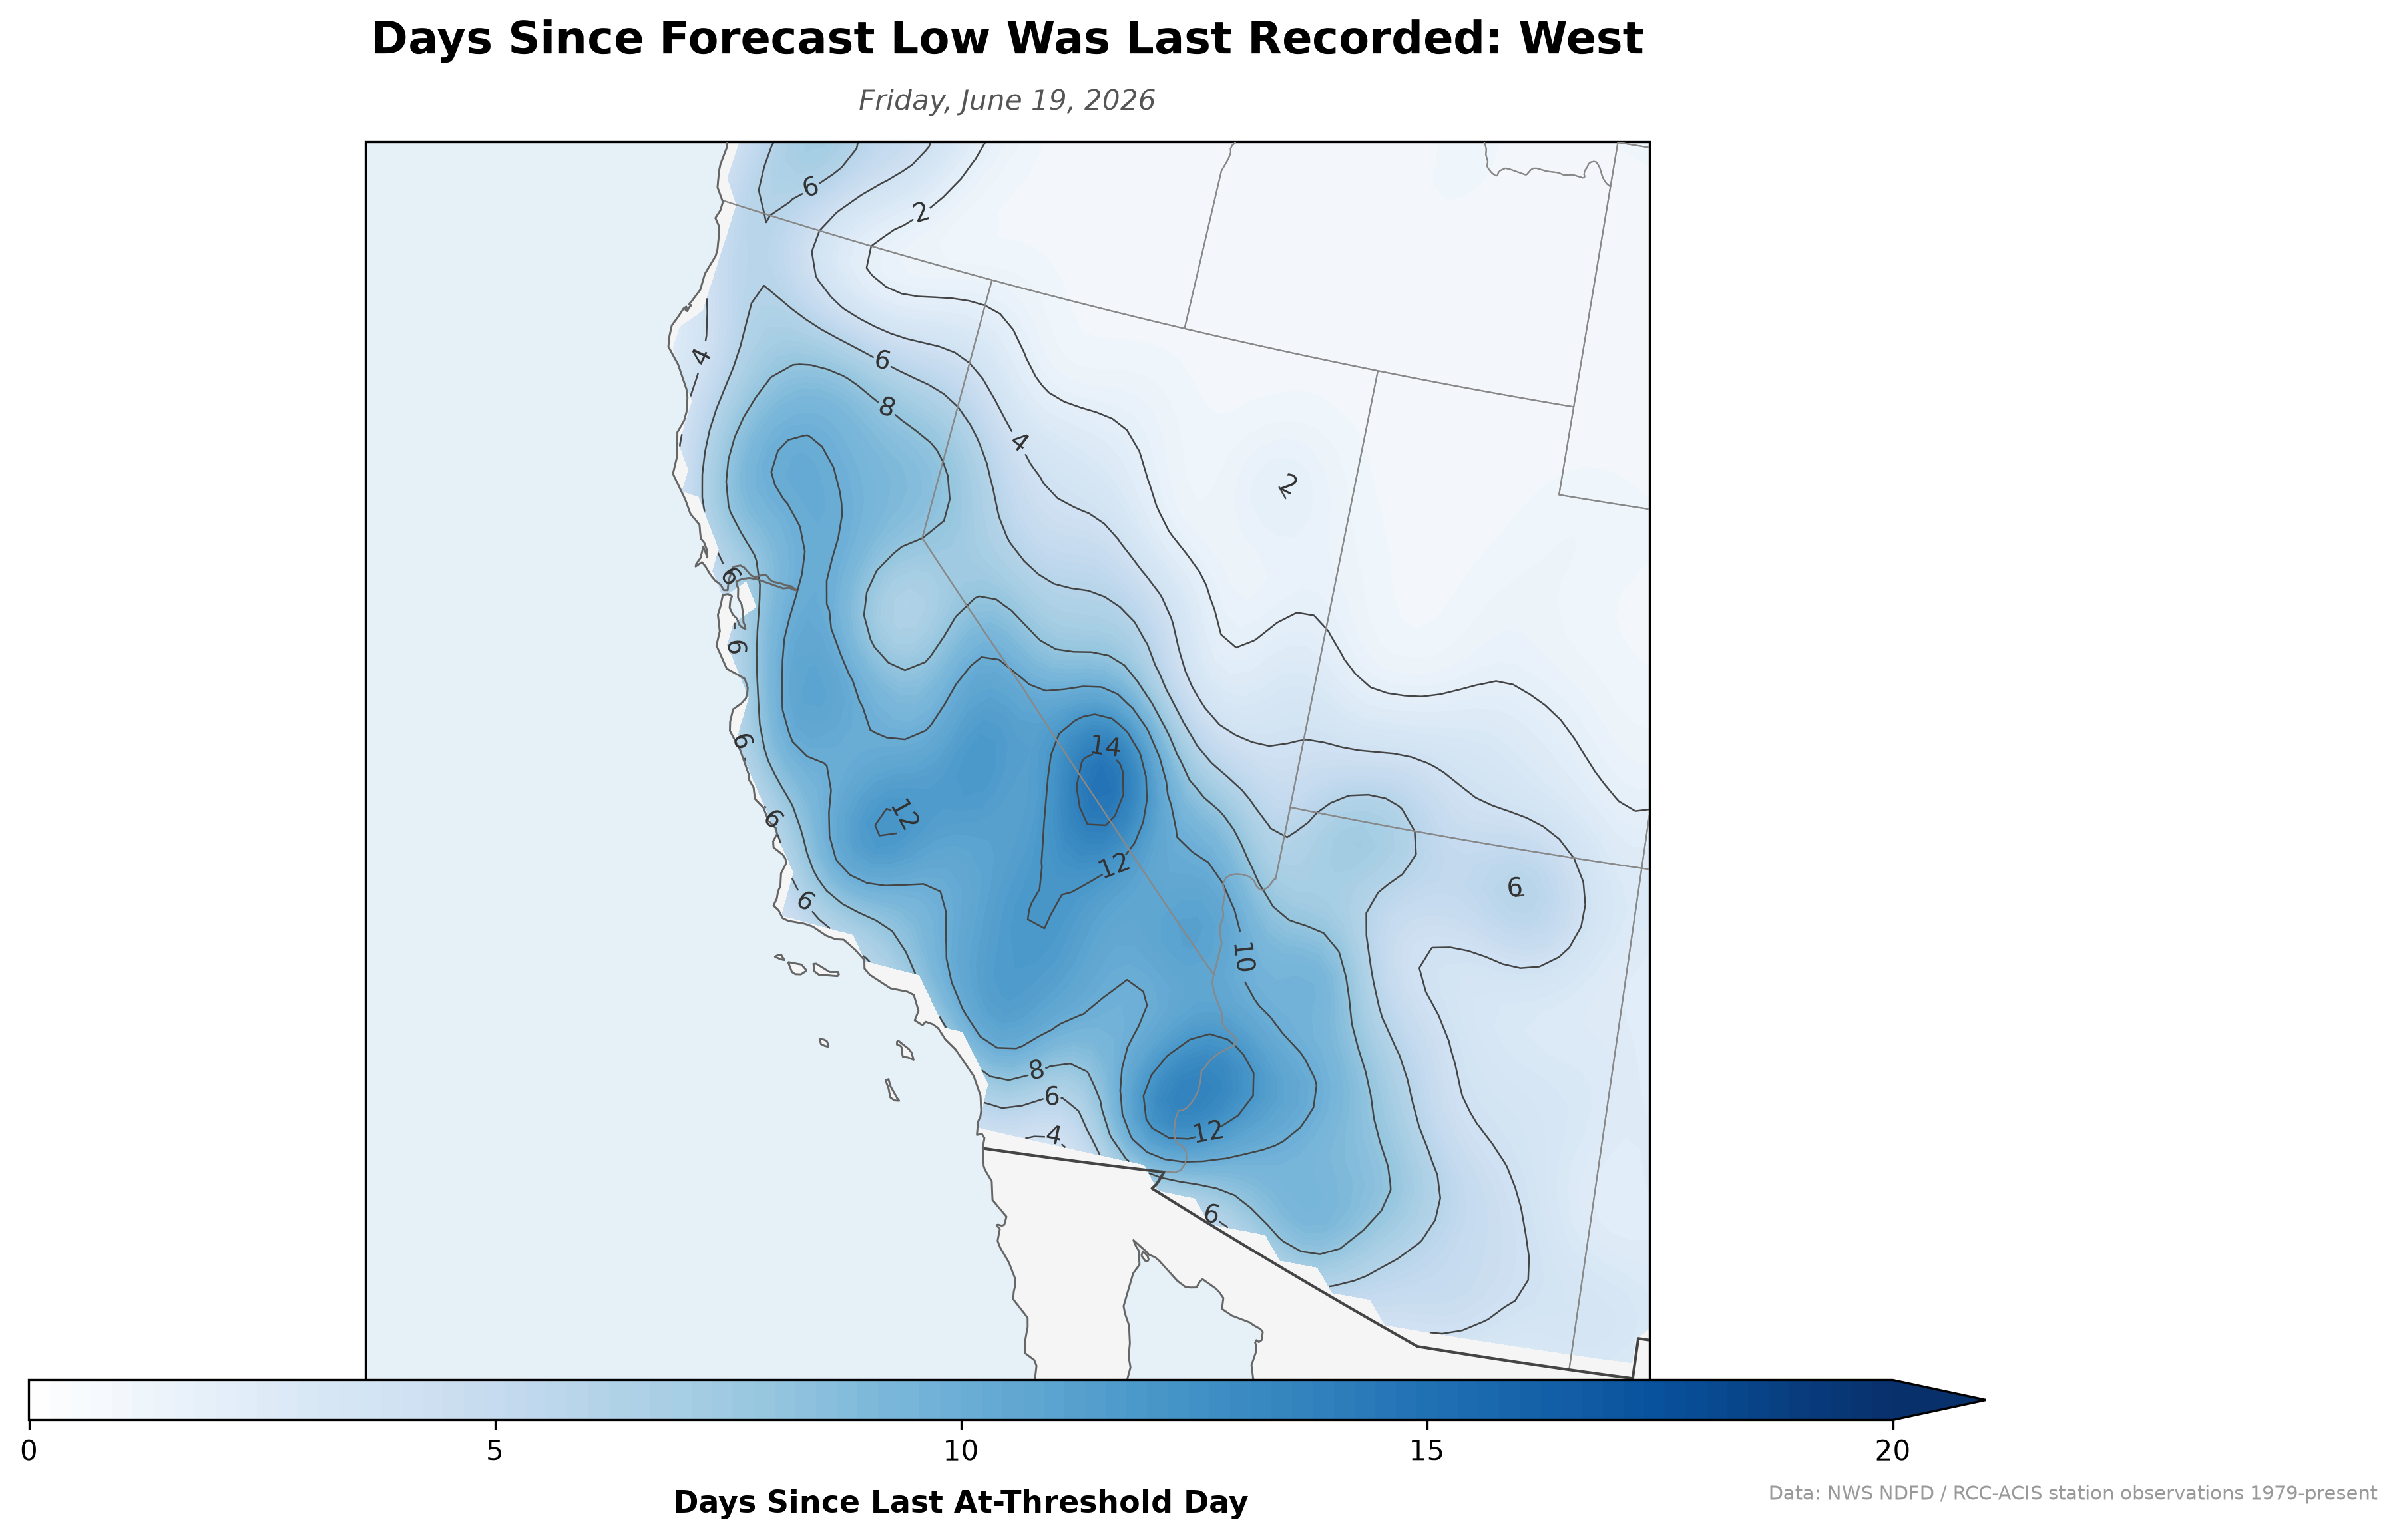
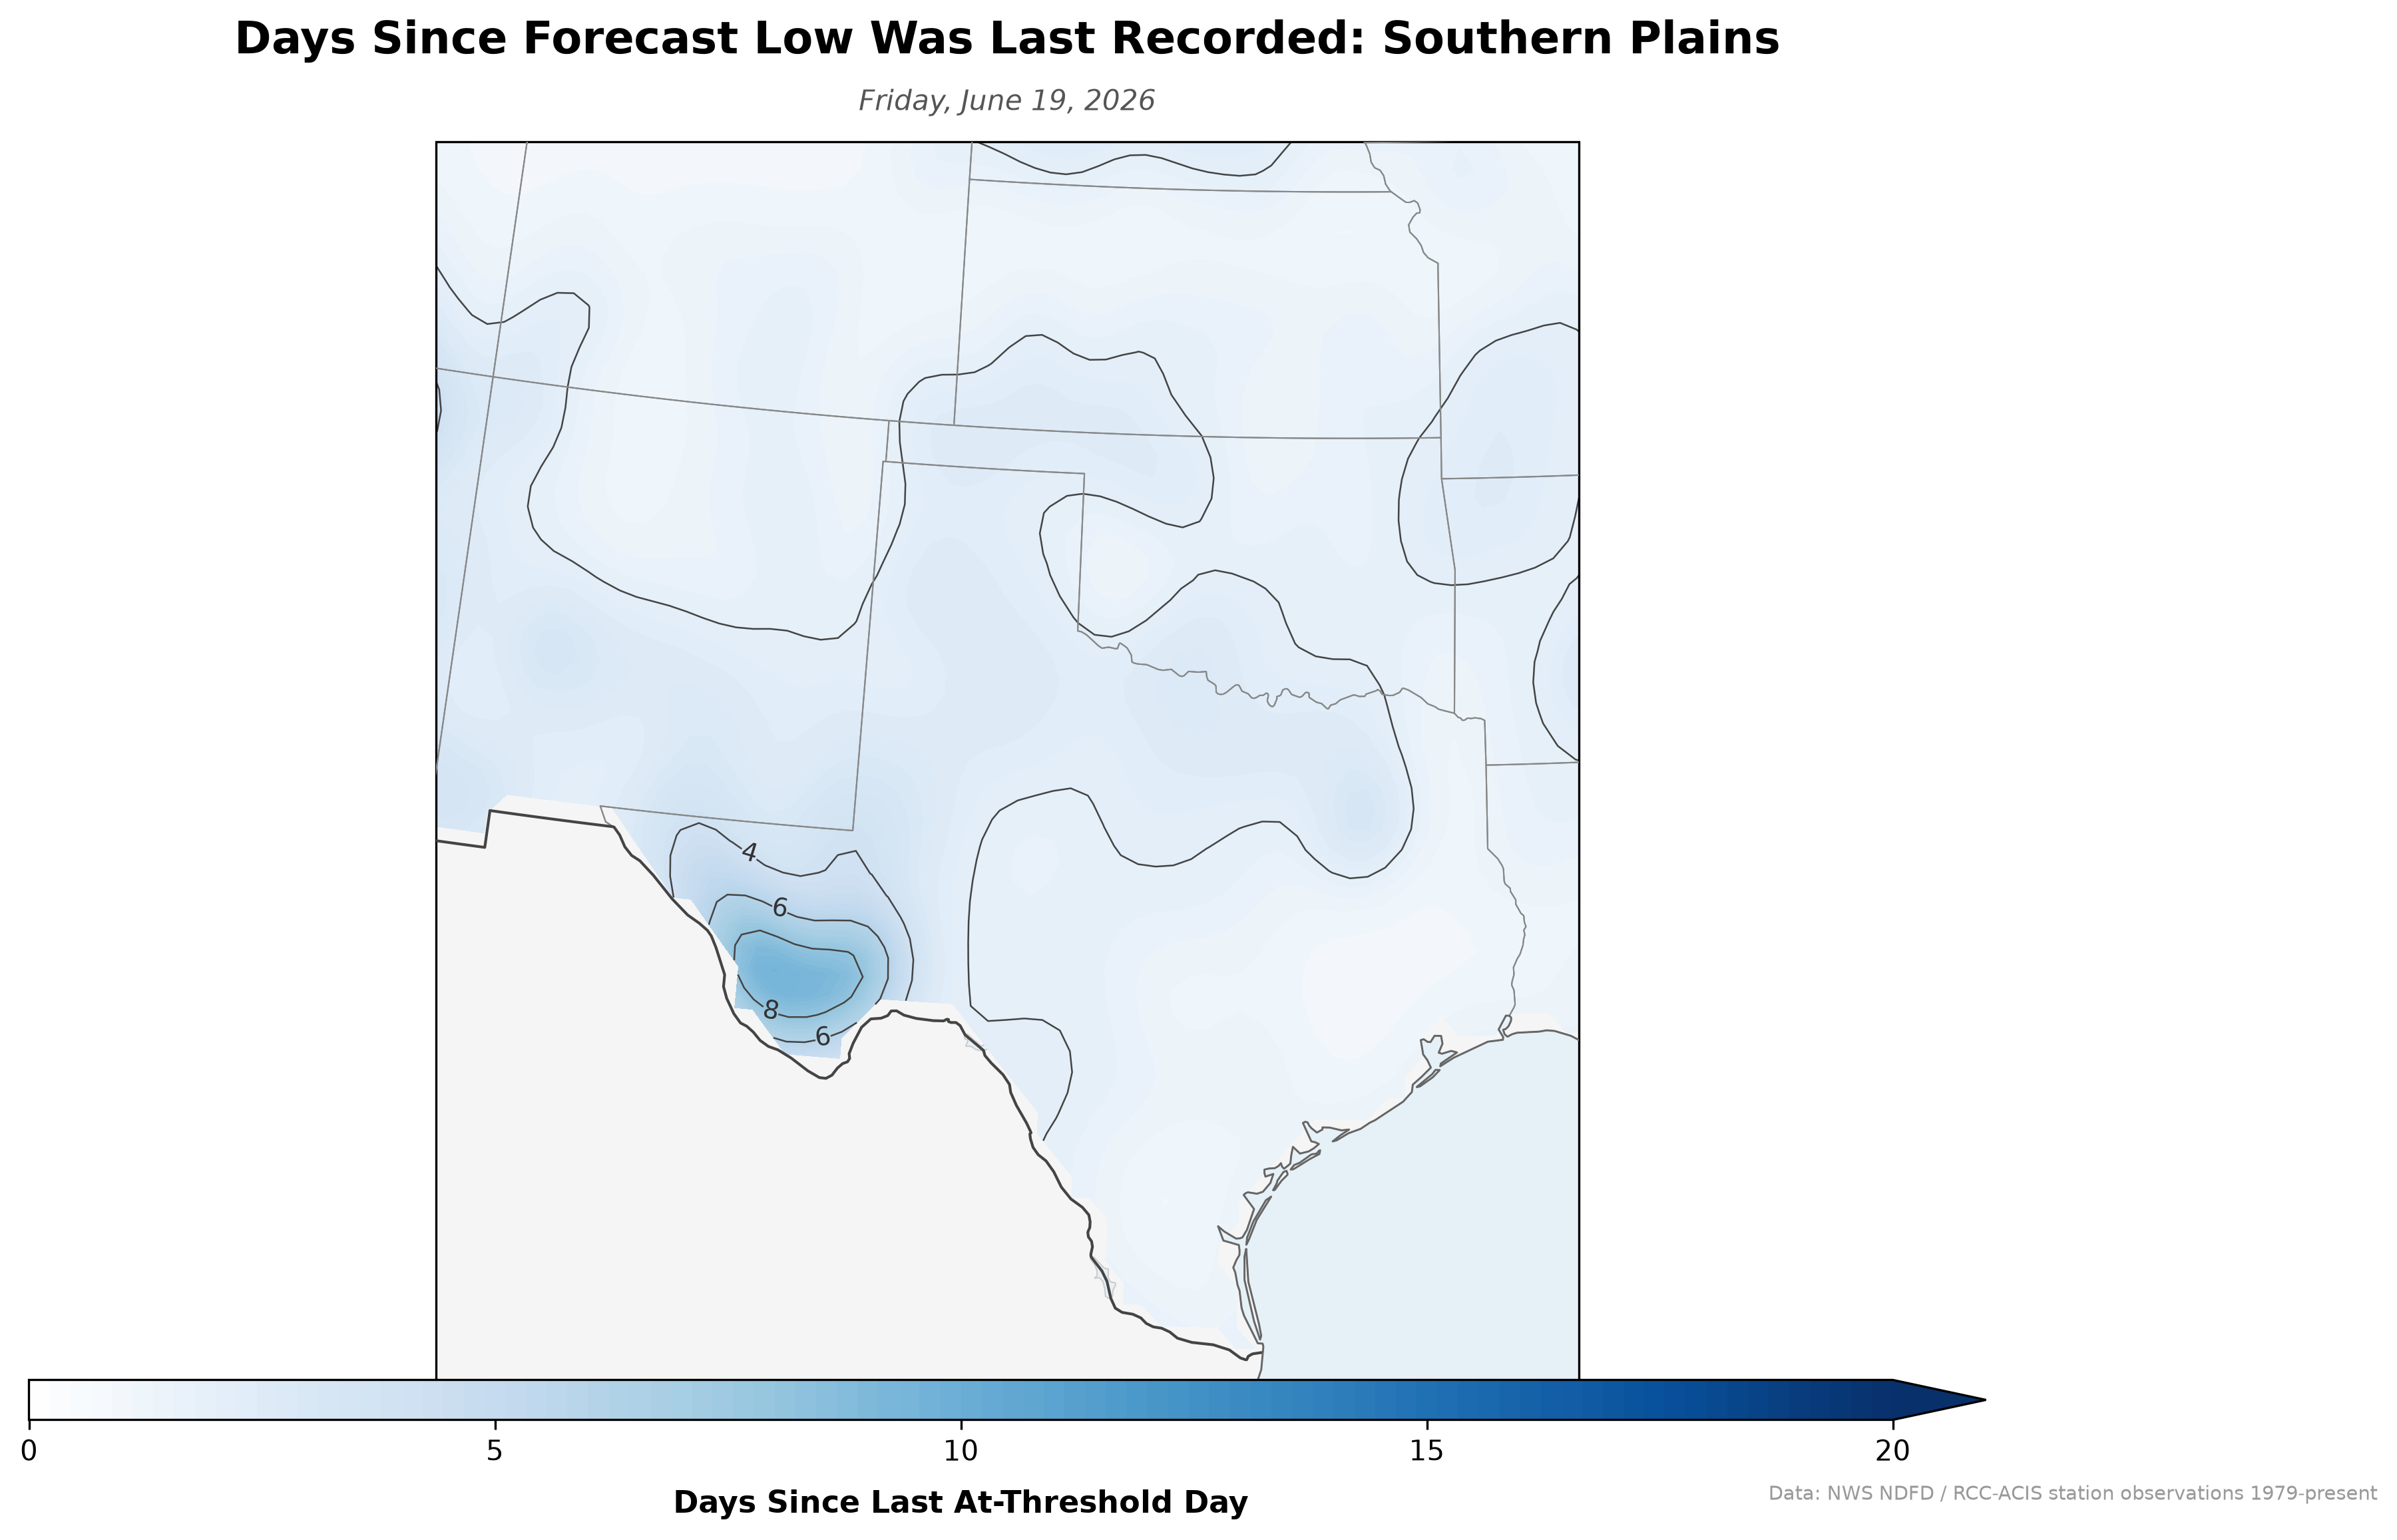
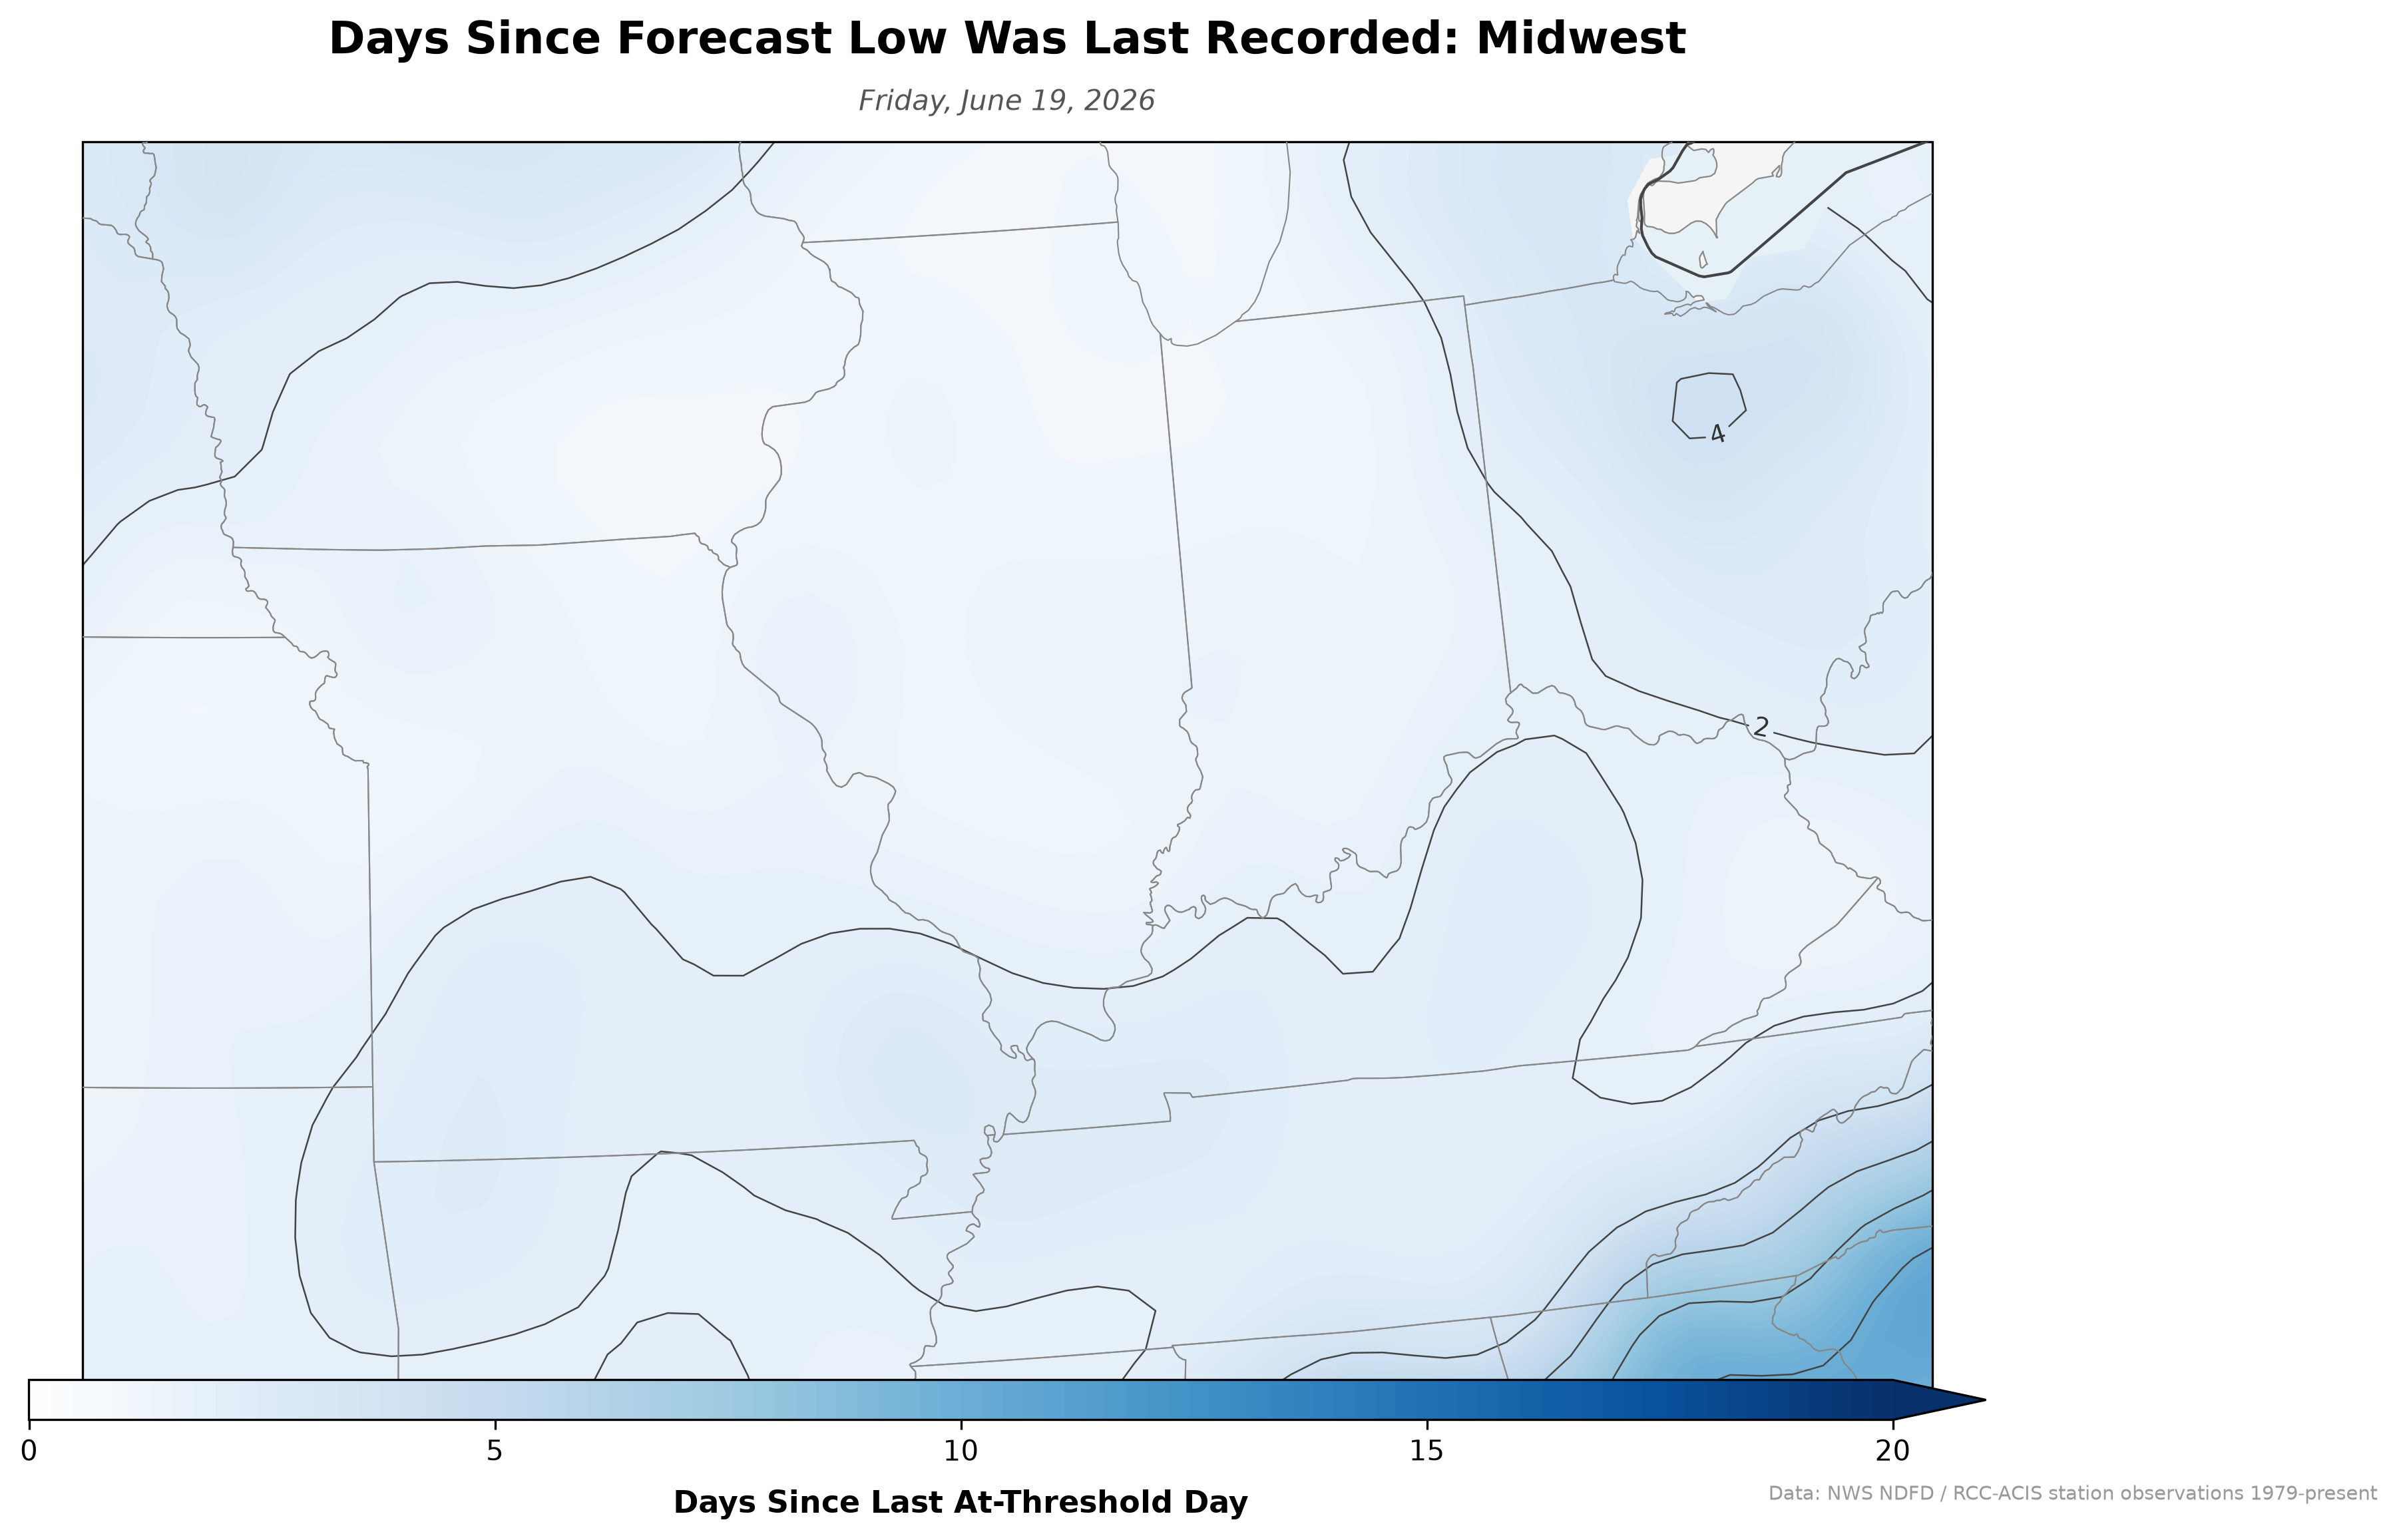
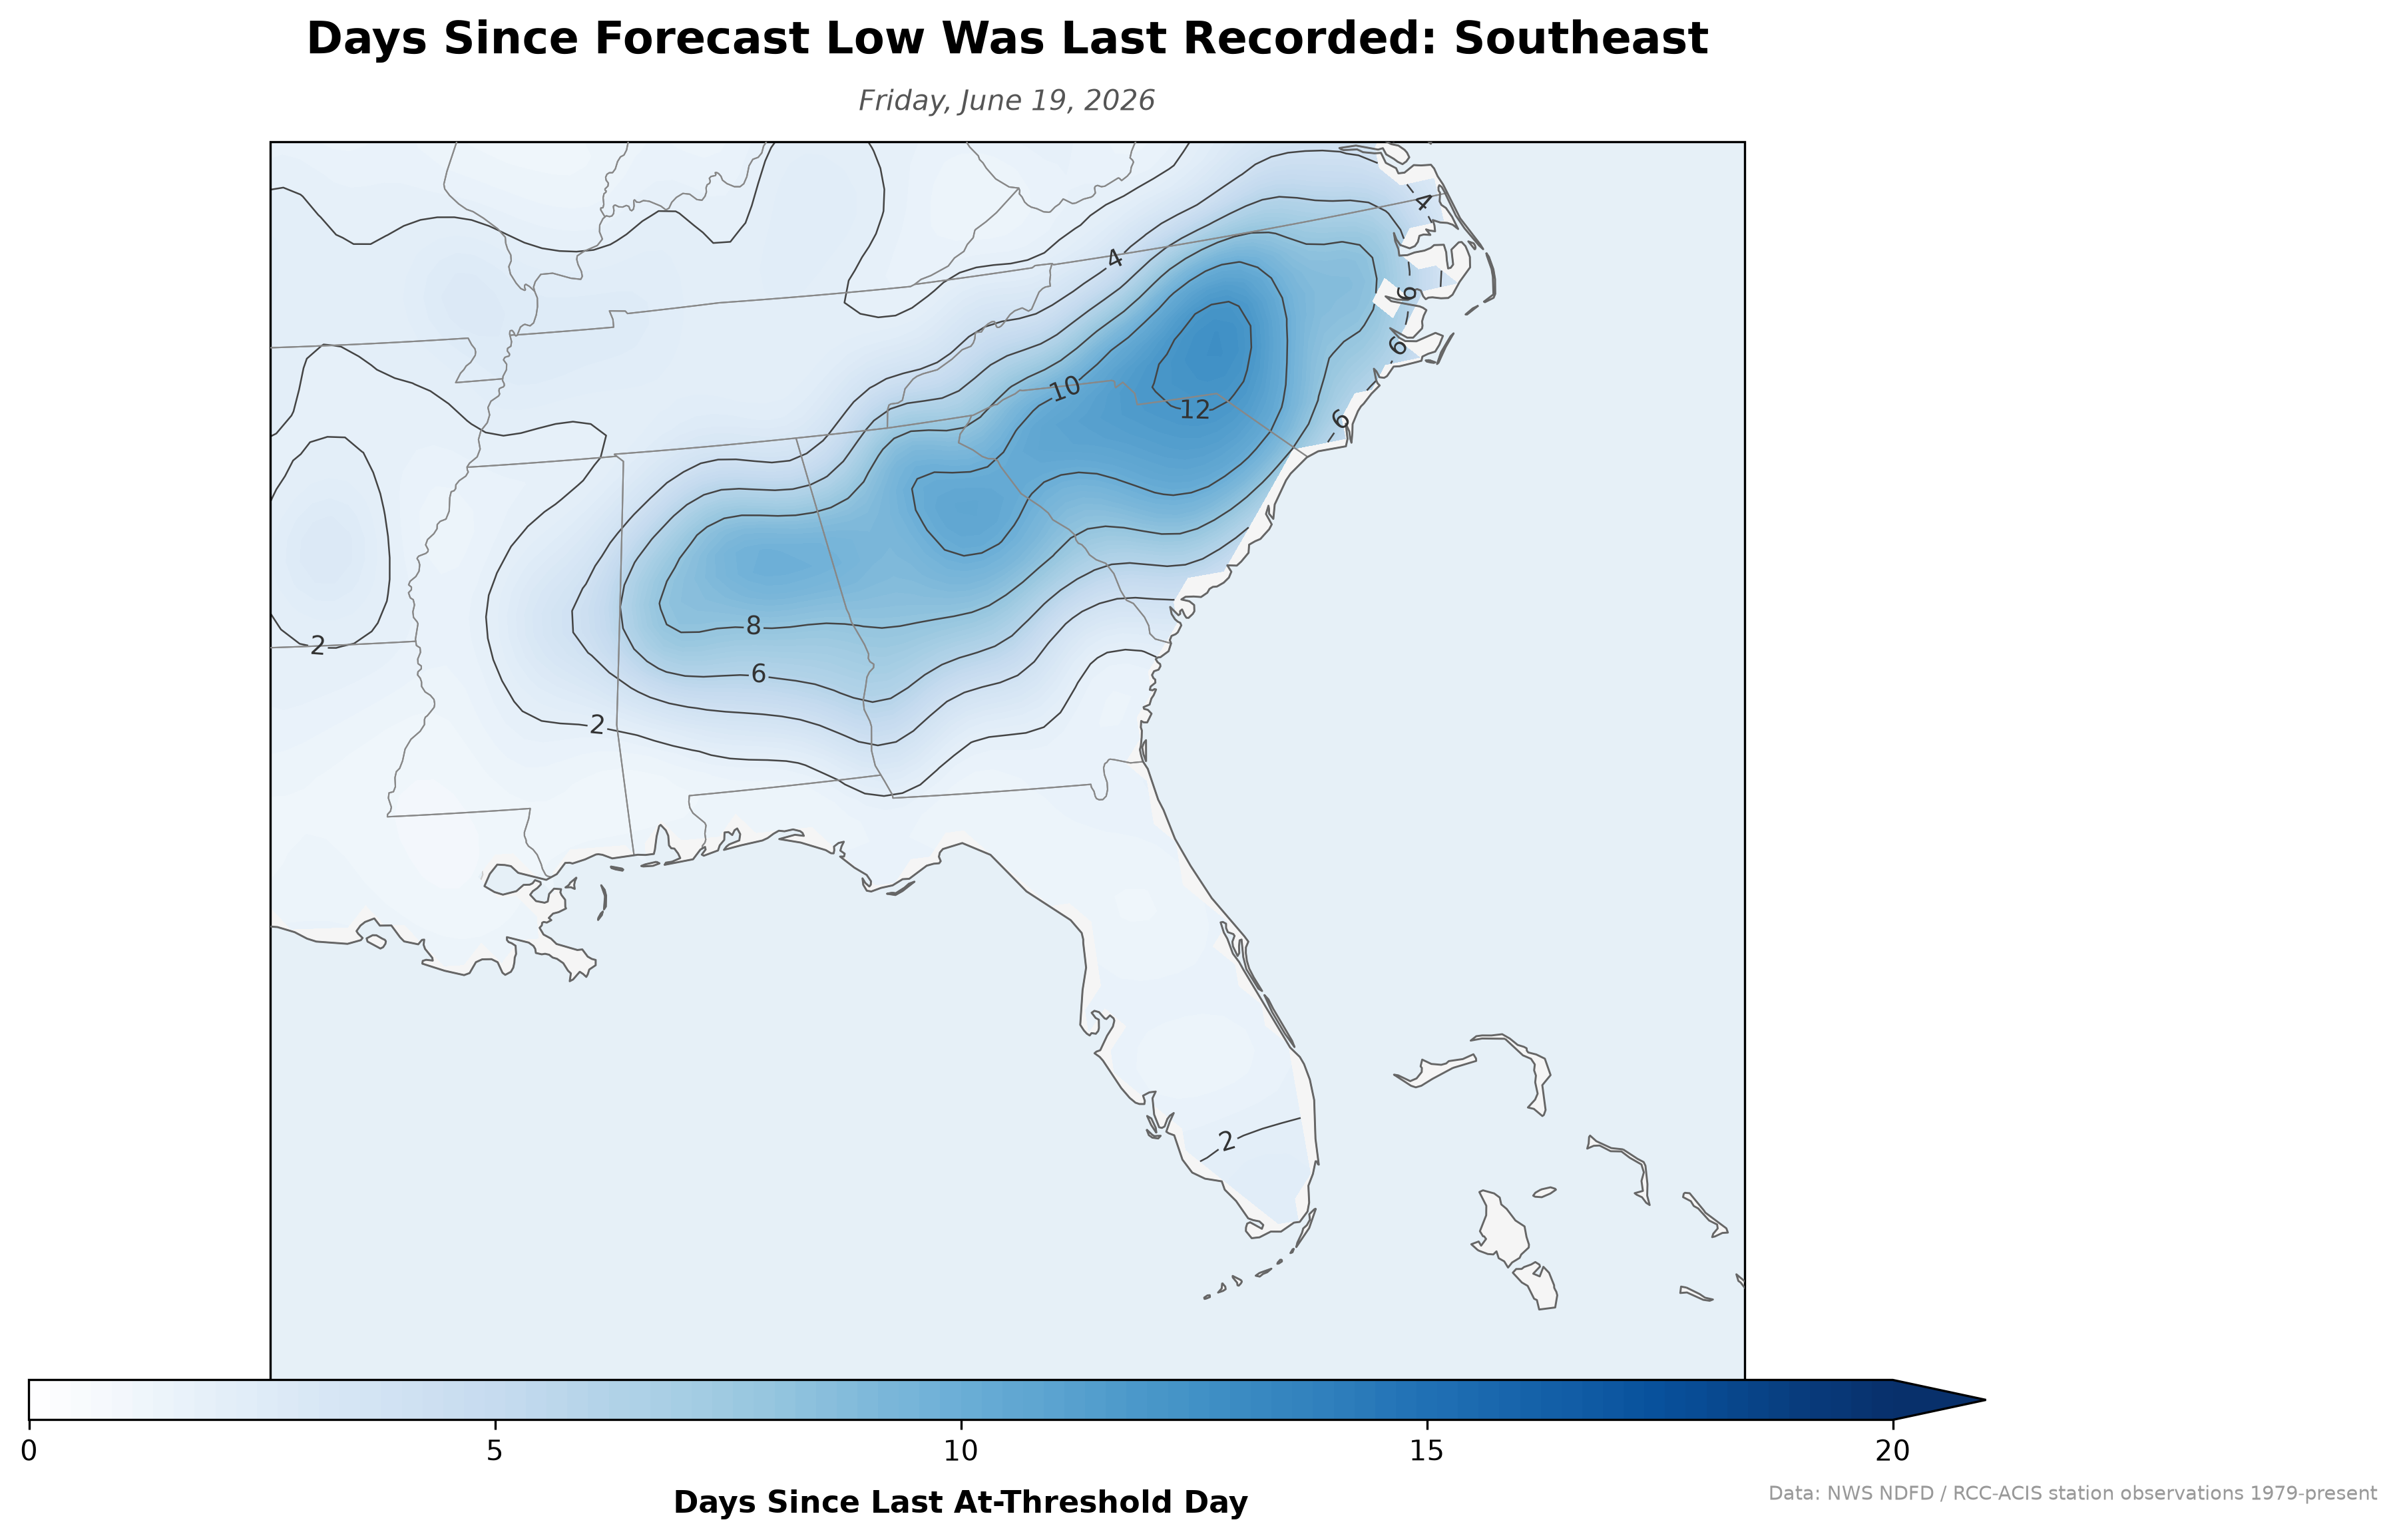
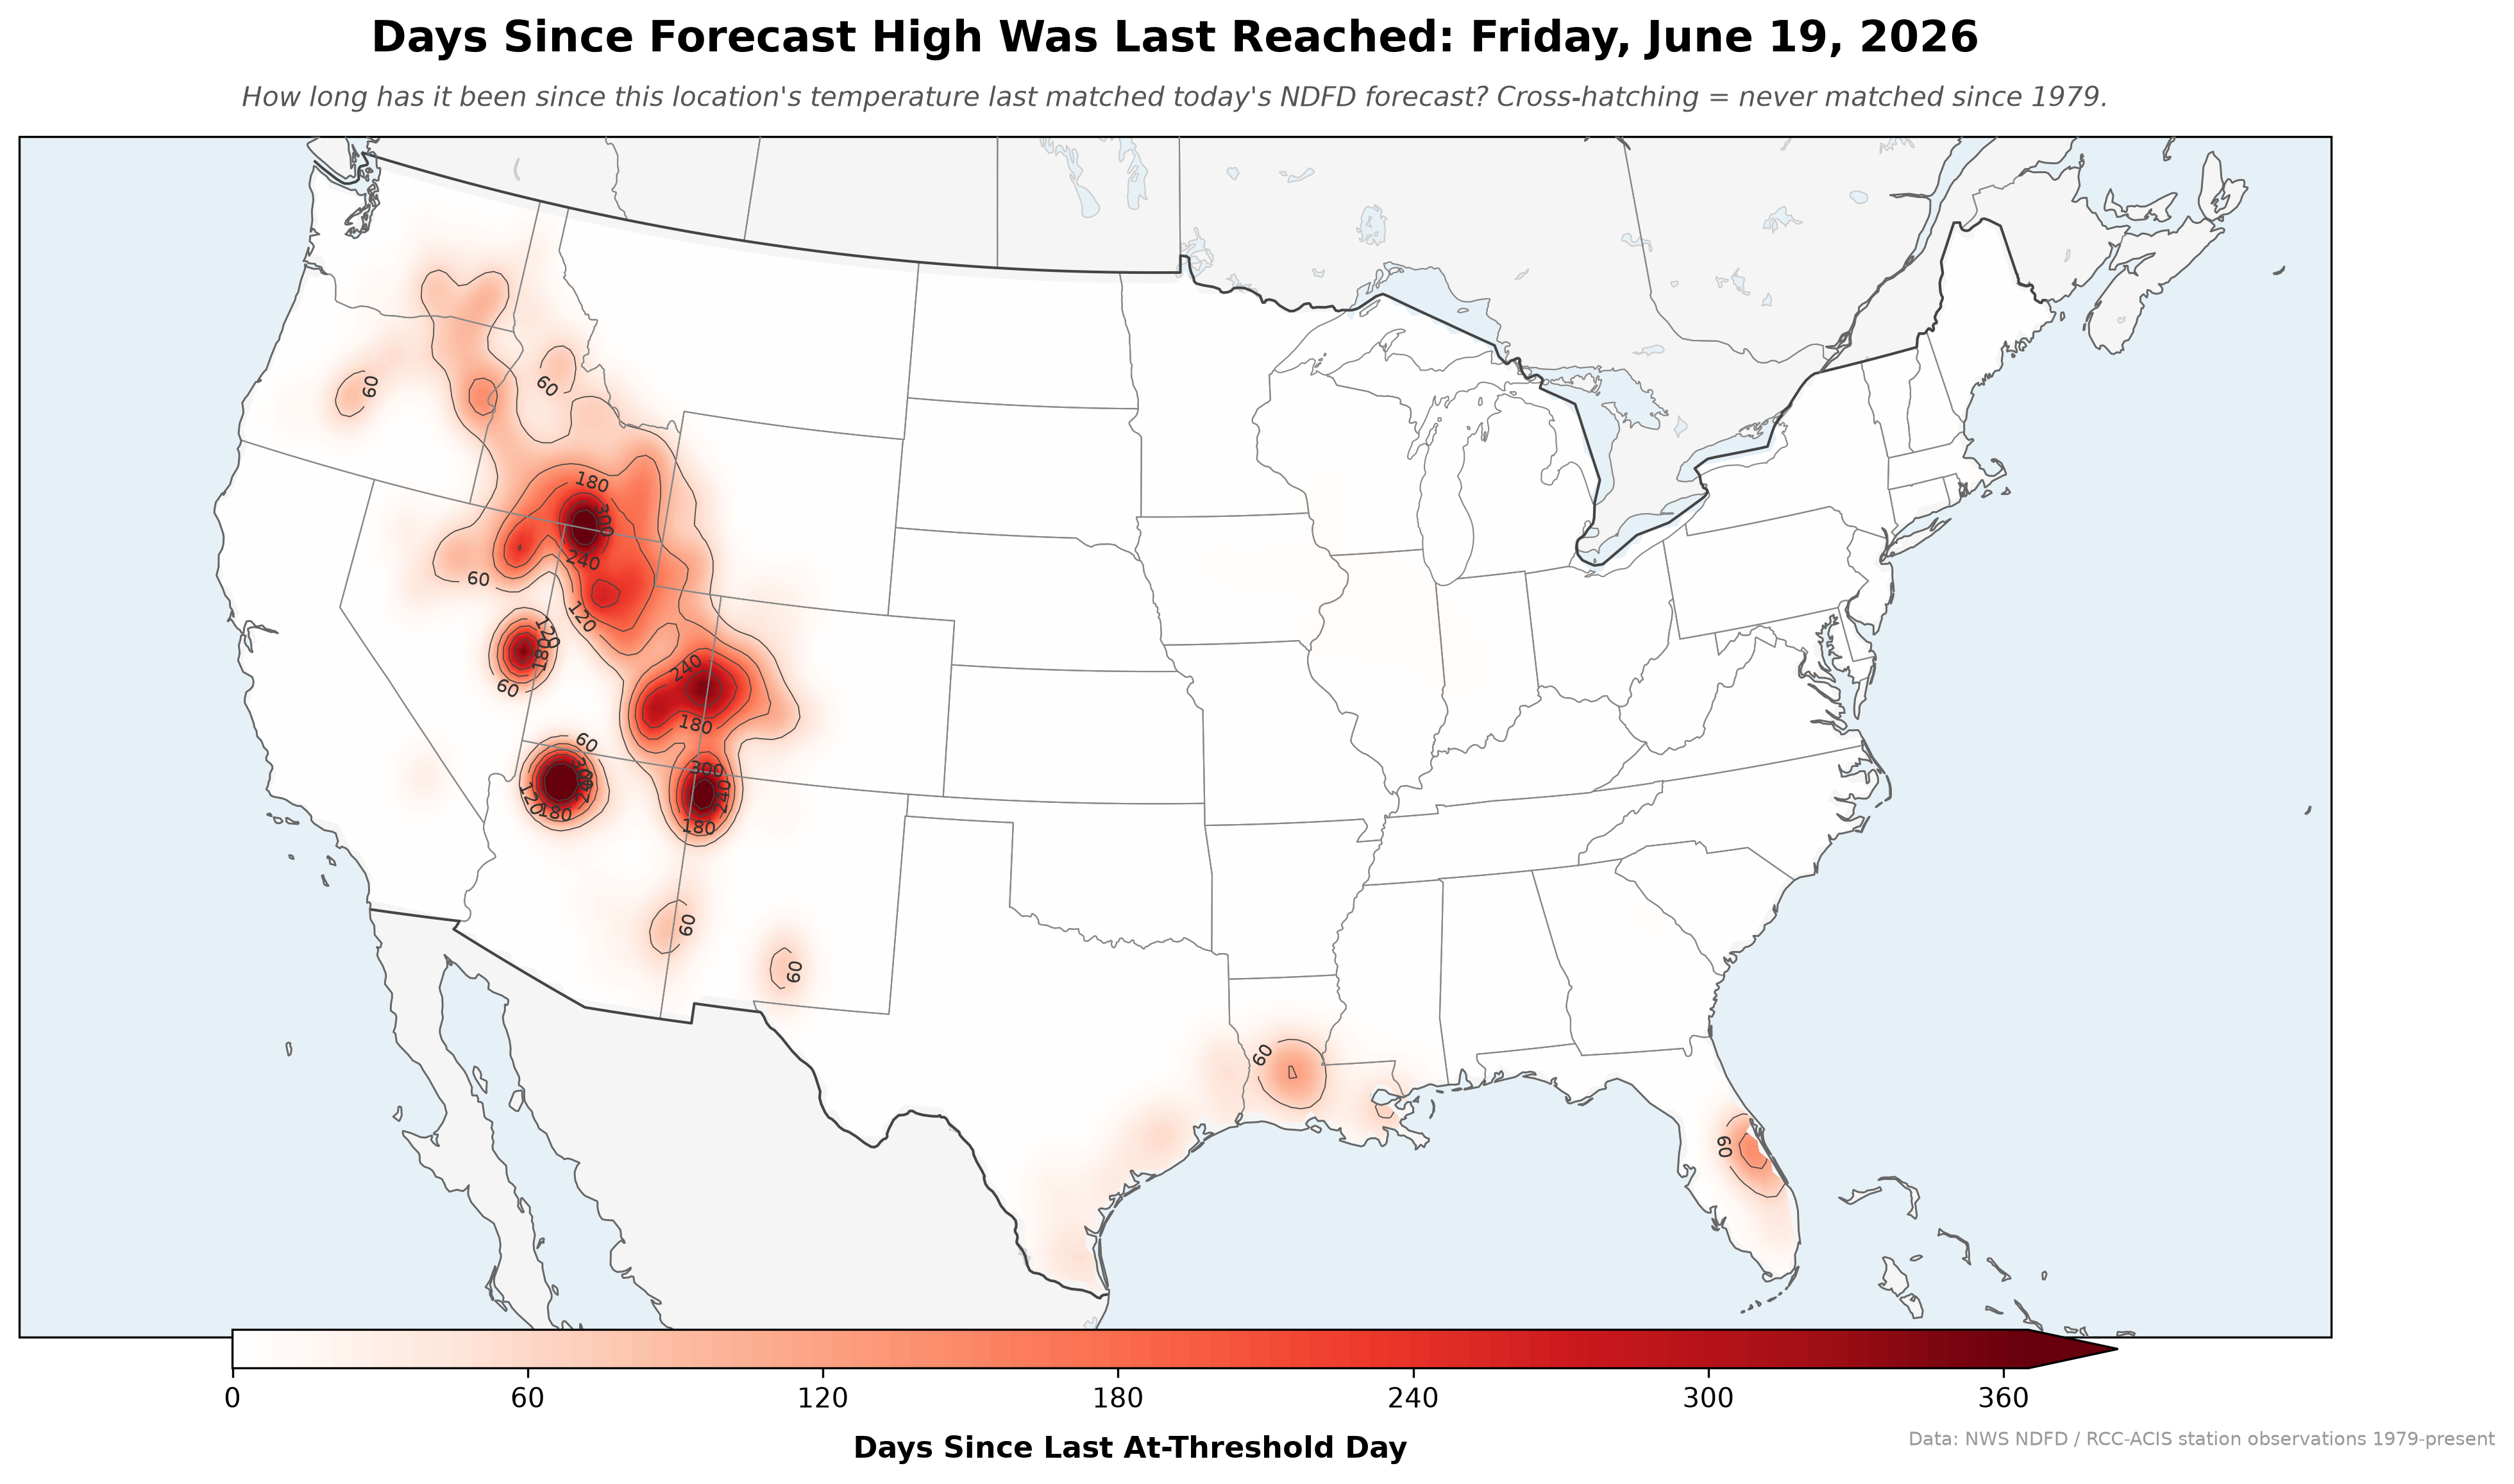
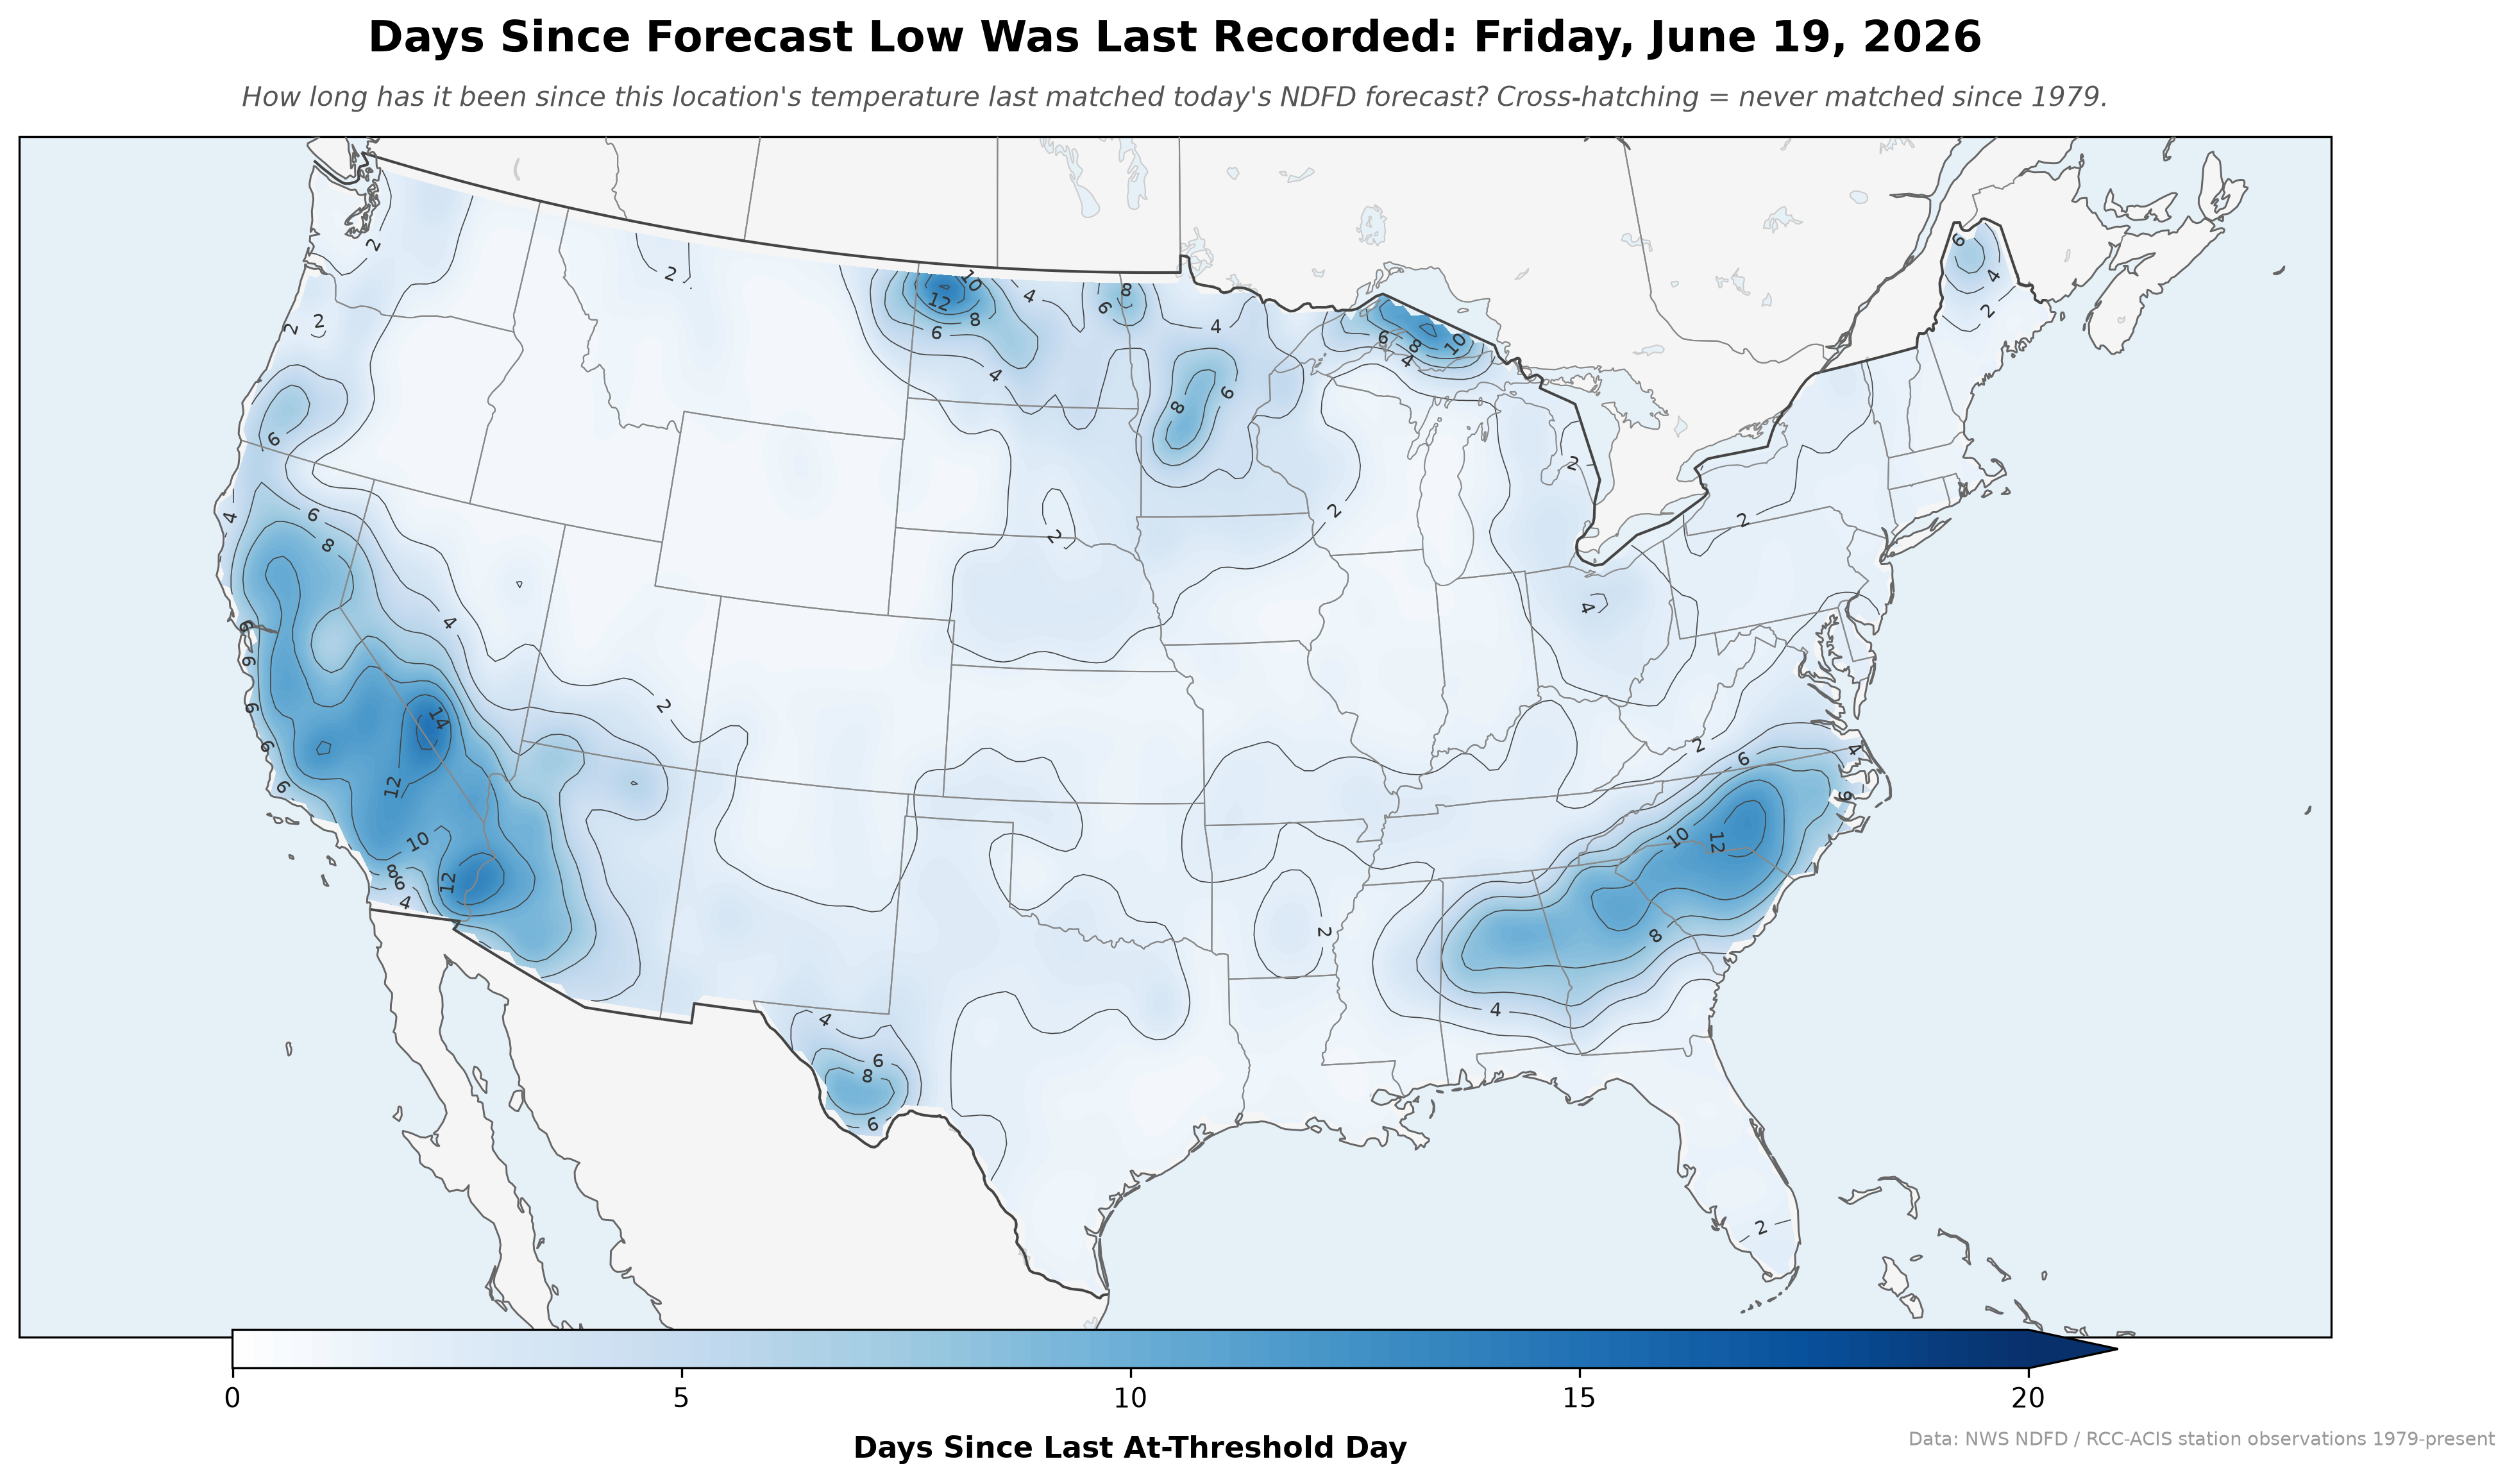
Time Since Temperature
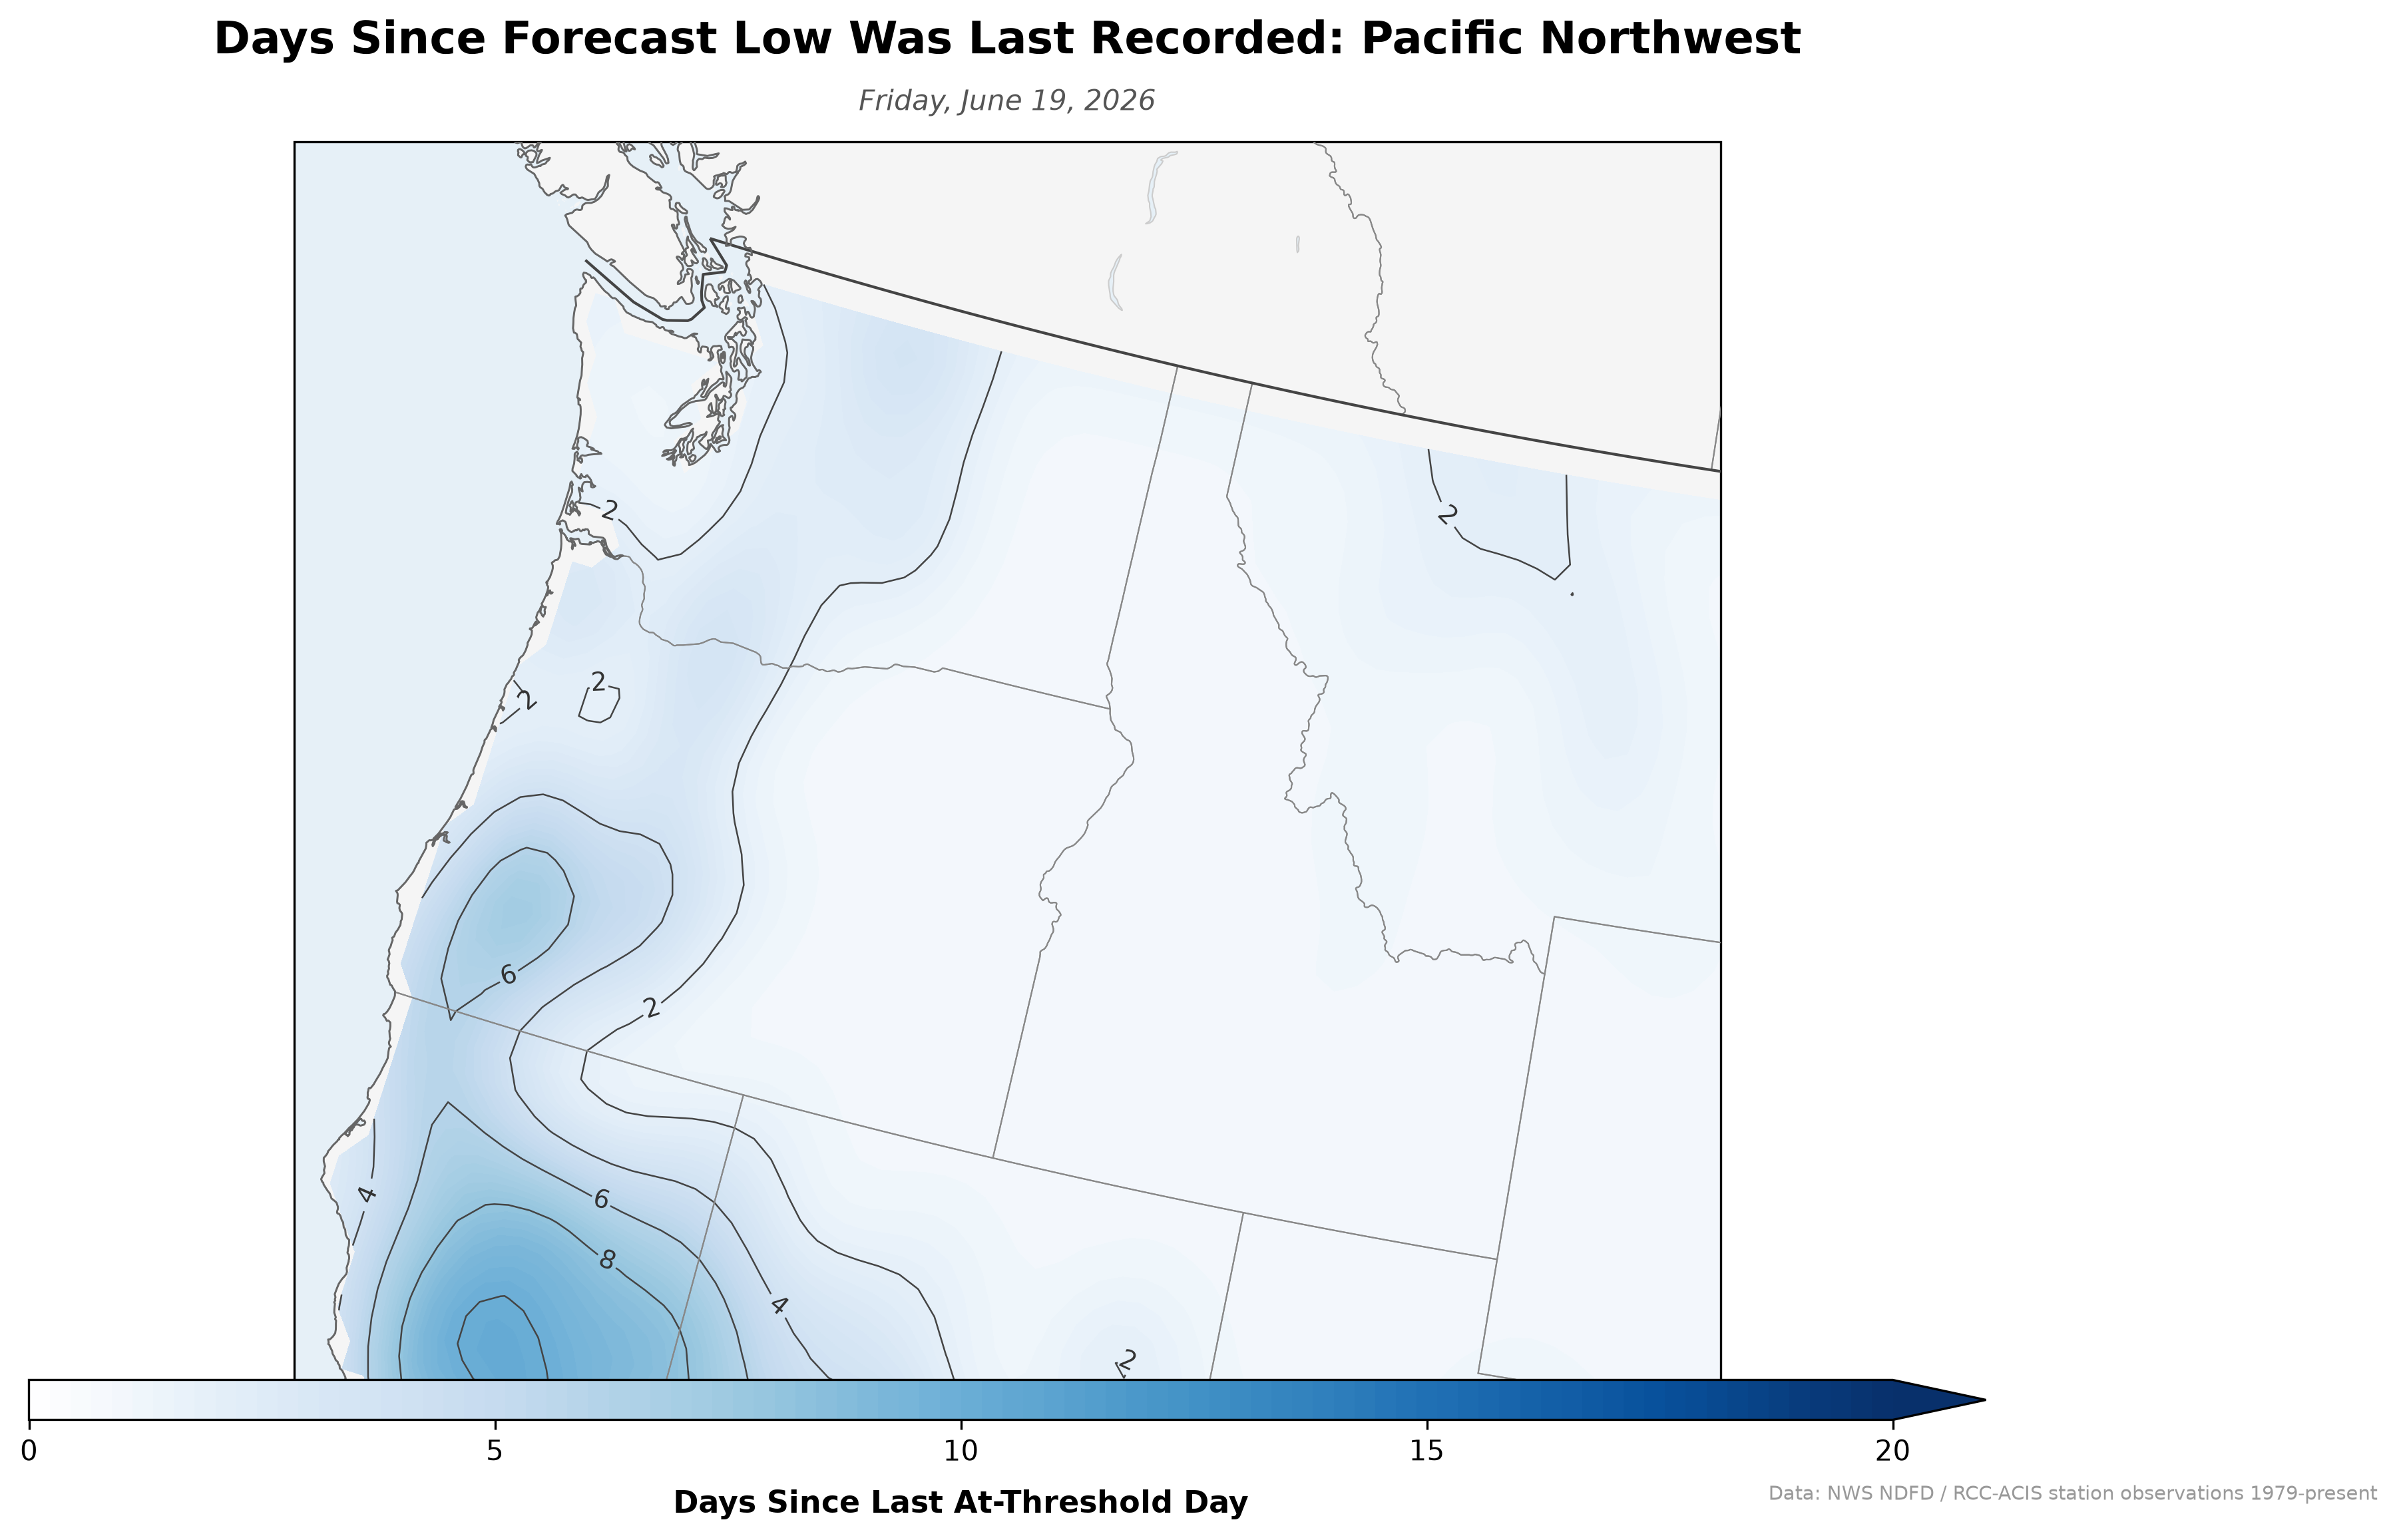
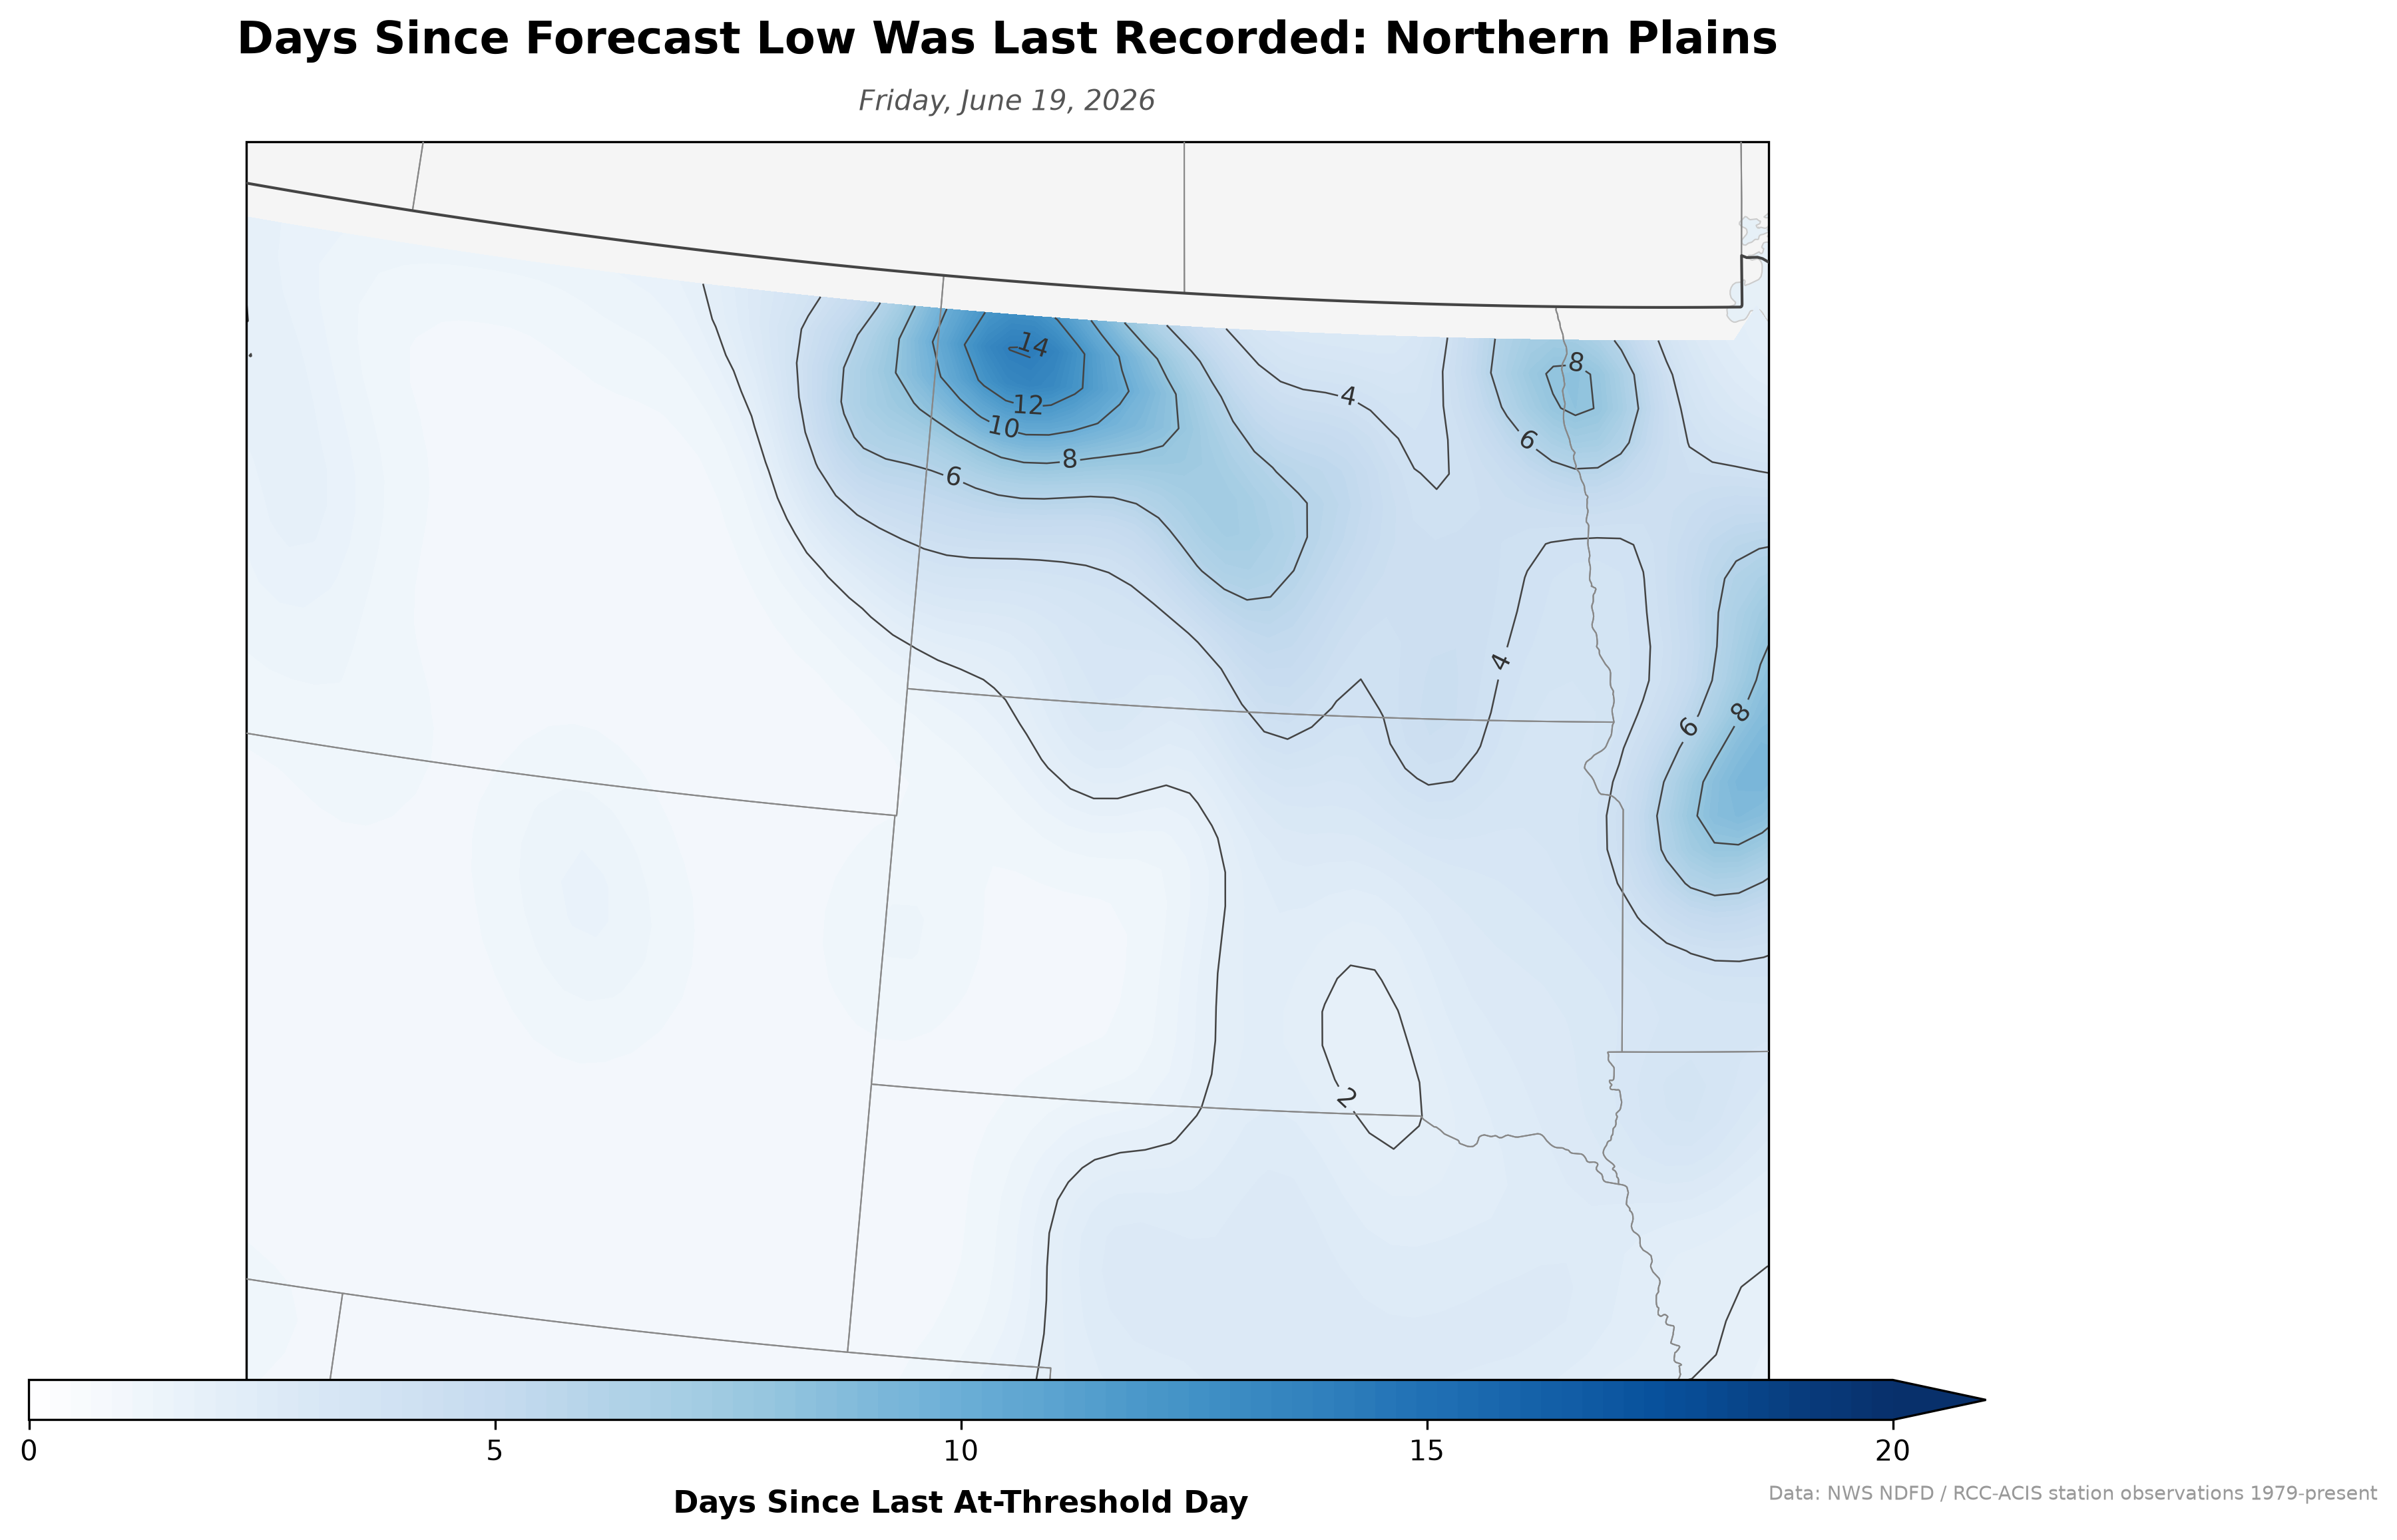
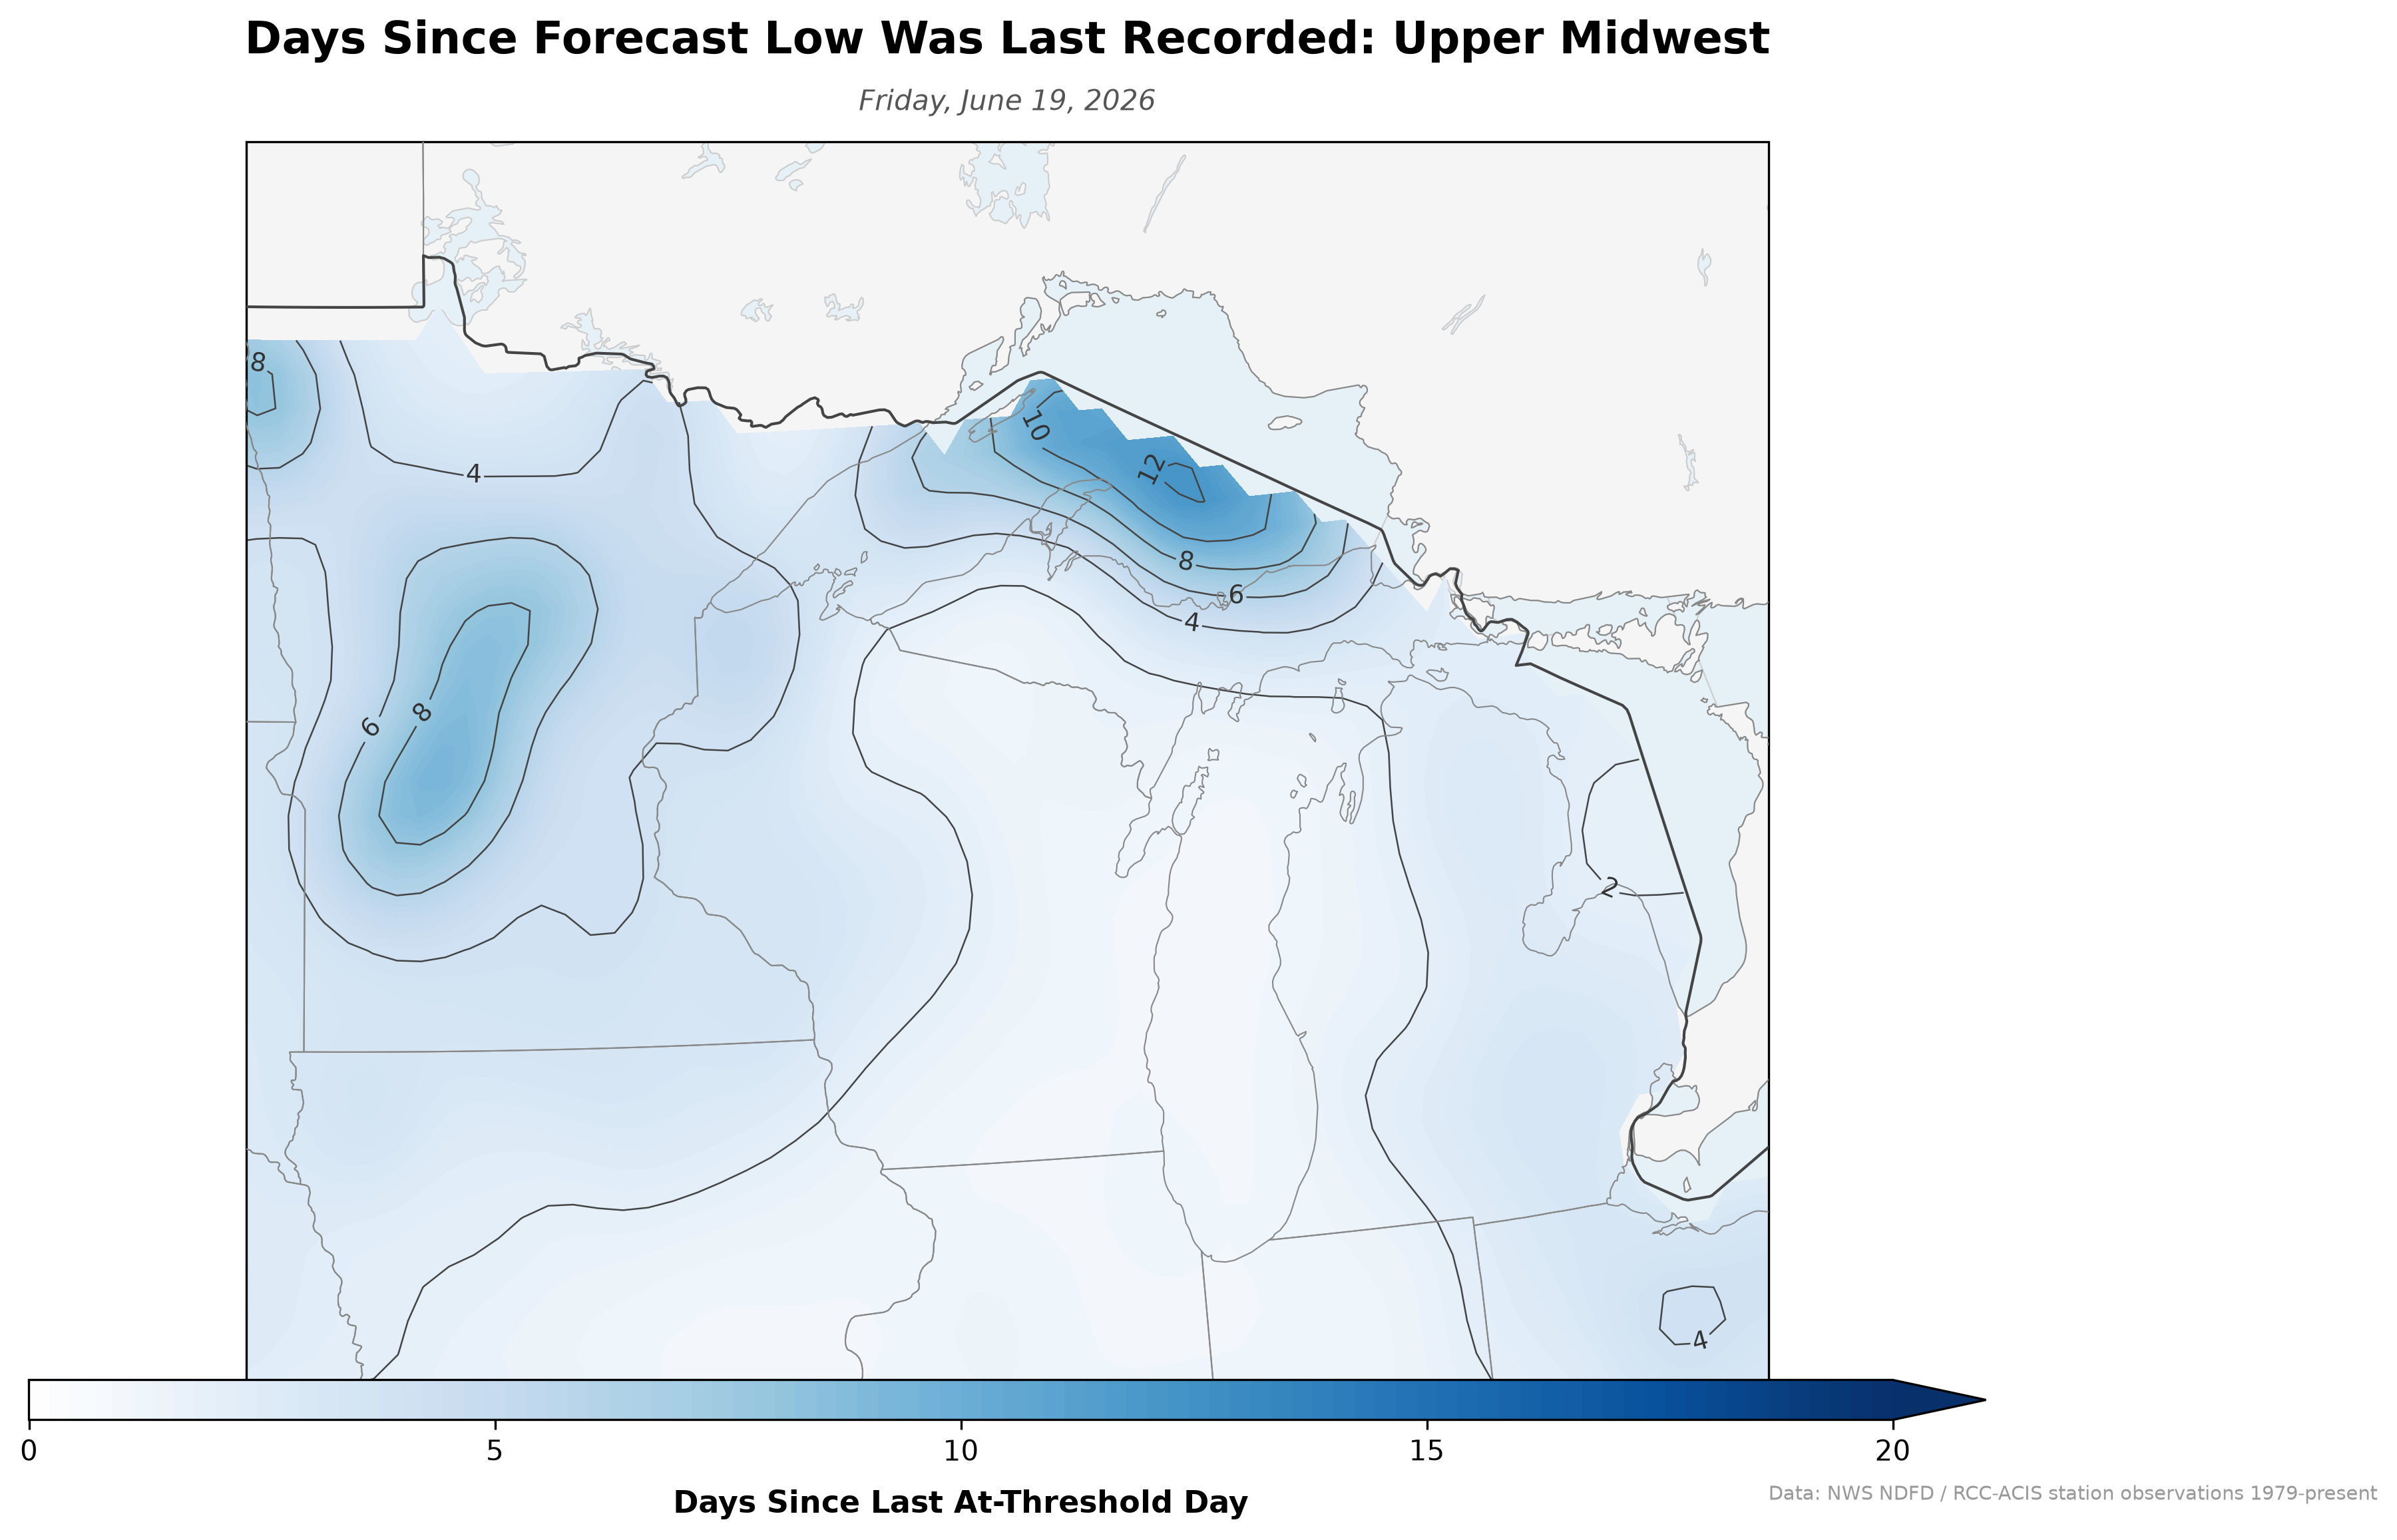
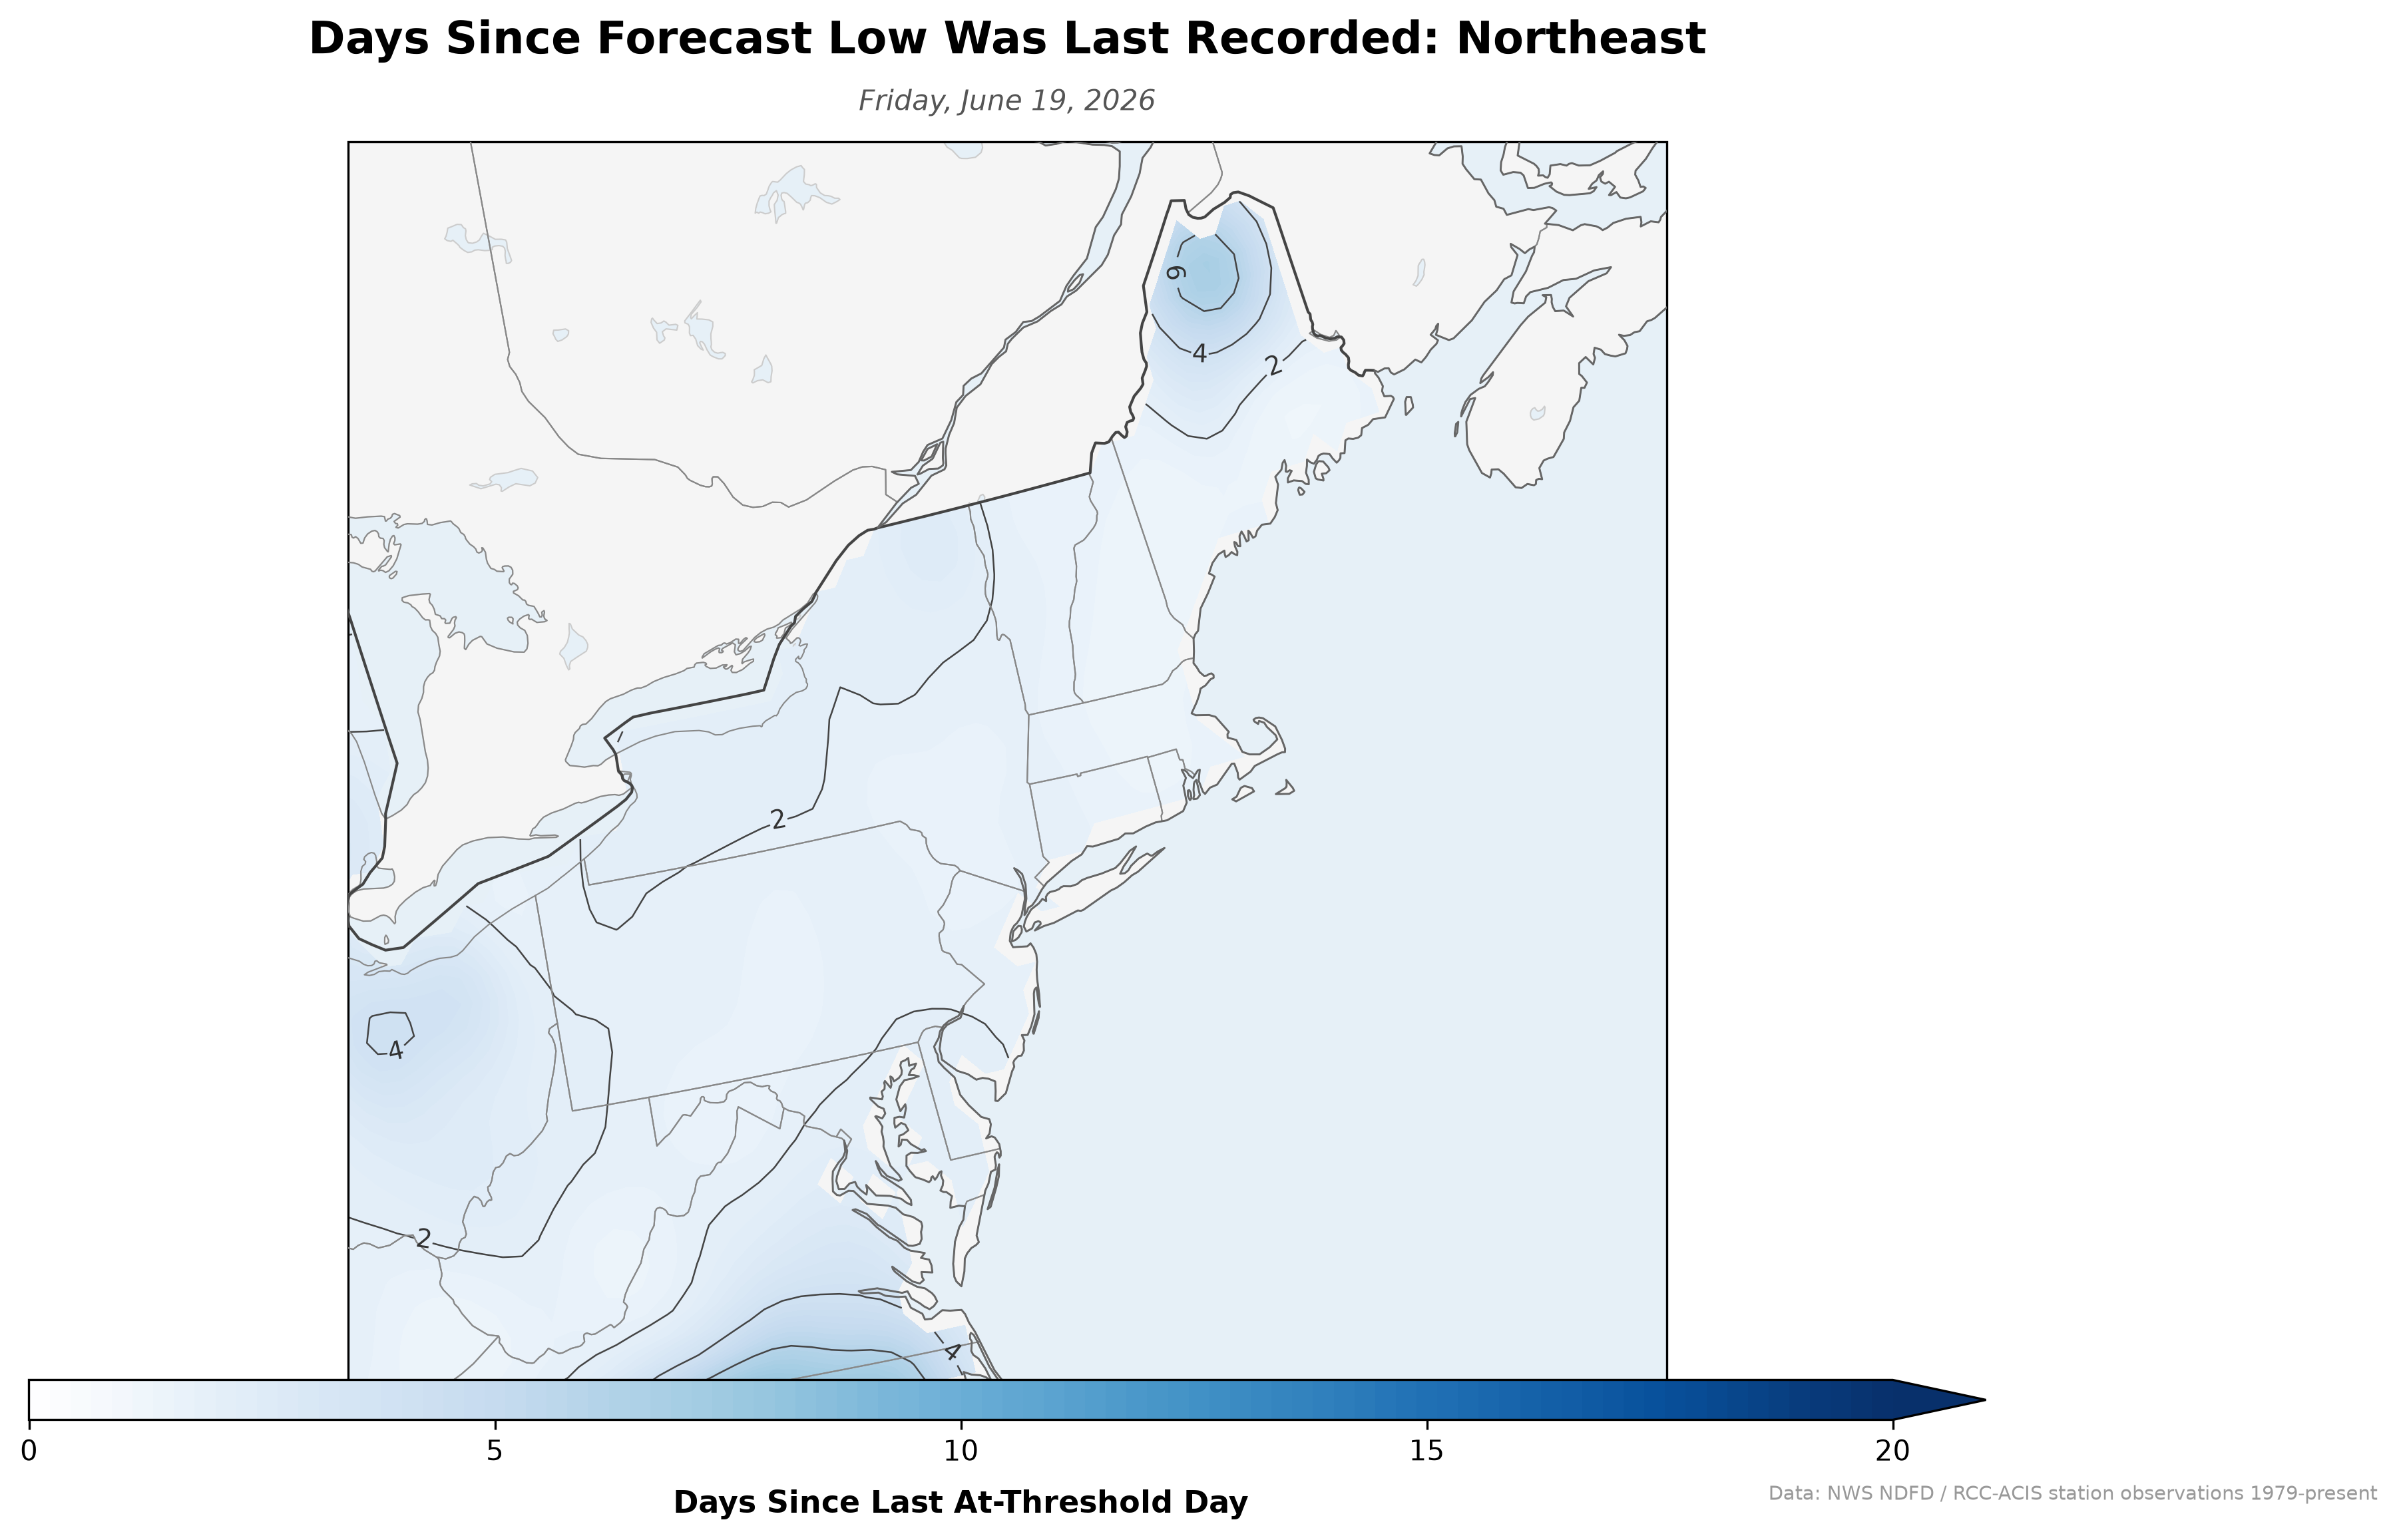
When was the last time this location was actually as hot — or as cold — as today's forecast? Each grid cell looks back at every observed daily maximum (or minimum) from 1979 to yesterday and reports the most recent day that matched or exceeded today's NDFD forecast. A reading of 30 days means “this hot last happened a month ago.” A reading of 5,000 days means “this hot is overdue by more than a decade.” Toggle between the forecast high and the forecast low below.
Click the map for full resolution.
This is an independent project and is not an official product of the National Weather Service or NOAA. Data: NWS NDFD forecast highs/lows for today, compared against RCC-ACIS daily station observations (~6,800 CONUS stations) from 1979 to yesterday, interpolated to a 0.25° grid.
Browse ArchiveRegional Views
Click any region for a full-resolution crop.